

Data analysis seventh step: fine tuning
The road so far
So, you started with a goal, you found some related datasets, pre-processed and processed them, and now you got results. But, after you validated the results…
… you are not happy: you want more and better. So, are we back to square one? Luckily, not at all!
The road ahead
If the results you obtained are not satisfactory, you still have different aces up your sleeve. Looking at the picture below with data analysis main steps, you could go back and do something better in each step, or you blindly restart from scratch. But, maybe, you can do it smarter. How? That is simple, and this is the reason I said we are not back to square one: you already did the procedure once, and if you have being orderly and diligent, you annotated (in your notebook) and commented (in your code) the criticalities and problems you crossed. At this point, you would say: “This is the major criticality, I knew it, but for the sake of having the preliminary results I did not go to the bottom of the question. Now I have preliminary results, but I’m not fine with them. Now and here it is the moment to take the bull by the horns, and see what happened.” The bull-equivalent could be that you did not have time to acquire more data, or that you prefer not understand better those strange outliers, or maybe the model you used was a very simple toy-model [1].In this sense, the procedure to reach the preliminary results is like the first iteration, the prototype step of a more complete path. In this second iteration, you are aware of the lesson learned and you can do it better. The procedure is a descending-spiral one, as in the knowledge spiral one. If you think at an agile approach, it is the second step after adding a requirement on a better performance. Using the “Technical Readiness Level” language, it is like going from level 6 to 7 (I’m trying to be schematic!).
Now I have preliminary results, but I’m not fine with them. Now and here it is the moment to take the bull by the horns, and see what happened.
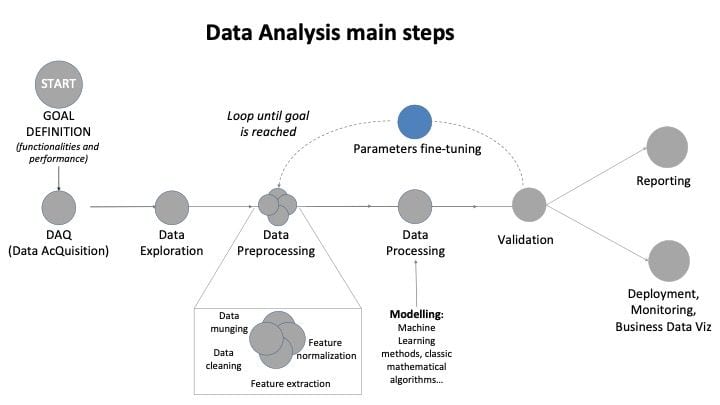
Figure 1: Data Analysis main steps: focus on fine tuning
Lesson learned become tip and tricks!
1. The fine tuning will be fast and effective if for each precedent step you keep documentation, named the documents in an easy-to-remember way, paid attention to order and details.
2. “Don’t throw the baby out with the bathwater”: do not start all from scratch but keep was useful.
3. Before attacking fast-and-furiously your code looking for errors, try to think if there is an underlying problem you did not consider before, maybe because you did not know it was related to this activity, or maybe because you forgot. There is no shame in committing mistakes. The shame is when you decide to under evaluate them.
4. Sometimes you do not need to set major improvements or modification. Sometimes you just need an additional parameter in a fitting function, or setting the initialization of an optimization to a smarter point of the space-phase. That is the reason why it is called fine-tuning.
Real-world example
As a real-world example, let’s recall our previous article about data processing. In that post, we create a model predicting the power produced buy a photovoltaic plant using the irradiance as input, and we decided to use the functional form y= a*x + b, where y is the power (dependent variable), a is a fitting parameter, x is the irradiance and b is the intercept.
Could we do better? (Obviously, yes, or I’d be in trouble ?). For example, we could try to remove the intercept b, or we could add the module temperature in the fitting formula. The results are reported below, and you can see how making slightly different choices (that is, finetuning), you could get different r-Pearson values, and also the other score functions changes for the better of for the worse [2].
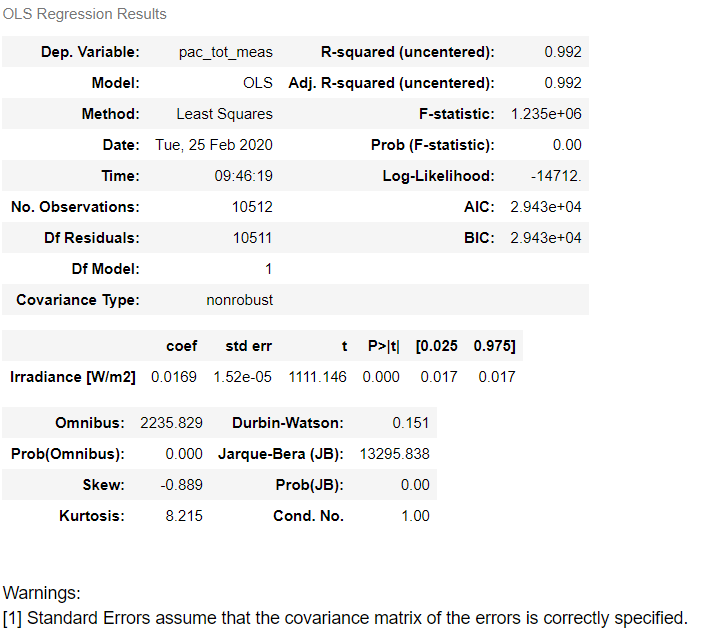
Figure 2: Model results using irradiance as input and no intercept in the functional form y= ax
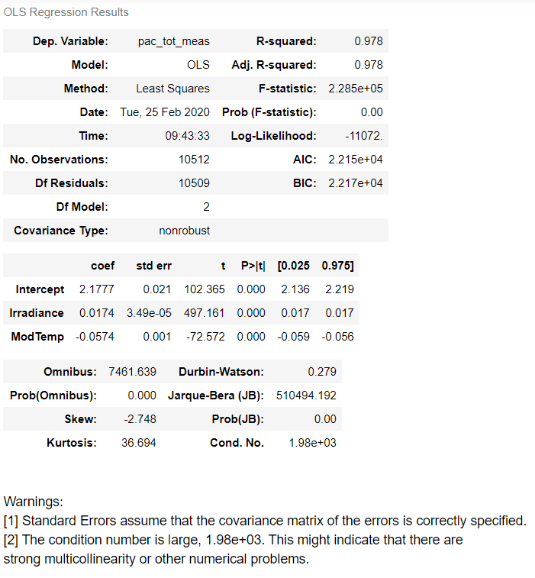
Figure 3: model results using irradiance and module temperature as inputs in the functional form y= a* irradiance + b*temperature + intercept
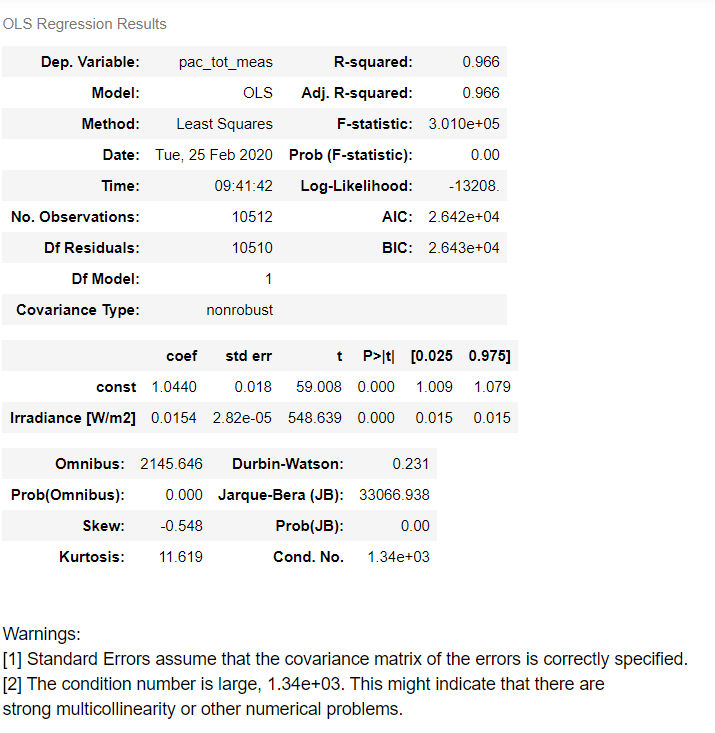
Figure 4: model results using just irradiance as input in the functional form y= ax + b

For the curious customer
At i-EM S.r.l., we think that a long journey starts from a single and smart step; also, we know that the devil is in the details, and a good procedure can help to take them into account.

For the keen reader
Some further readings I found interesting (not so much as my post, sorry for you…)
- What is the Difference Between a Parameter and a Hyperparameter? https://machinelearningmastery.com/difference-between-a-parameter-and-a-hyperparameter/
Useful and most used tools
R, SAS, SPSS, python, Julia, RapidMiner, MatLab, Weka, Scala, ROOT (Cern), Knime


A final word
Is it enough? Is it too much? I do not know, but for you should be easier to find out; after all, it was you that defined the goal…!
Notes
[1] A deliberately simplistic model with many details removed so that it can be used to explain/treat a mechanism concisely. (See reference)
[2] If you’d ask yourself “Oh, there is a lot of info here! How do I interpret them?”, then you’d win the “reader of the week” award. BUT! This is meat for a different post, sorry man. (See reference)
For the curious costumer
At i-EM S.r.l., we think that a long journey starts from a single and smart step; also, we know that the devil is in the details, and a good procedure can help to take them into account.
For the keen reader
Some further readings I found interesting (not so much as my post, sorry for you…)
- What is the Difference Between a Parameter and a Hyperparameter? https://machinelearningmastery.com/difference-between-a-parameter-and-a-hyperparameter/
Author

Fabrizio Ruffini, PhD
Senior Data Scientist at i-EM
Continue reading

The Rise of Grid Intelligence: Why Control and DMS Software Will Define the Next Phase of the Energy Transition
The electricity system is undergoing a structural transformation. Driven...

From Mission to Reality: Intelligent Solutions for the Energy Future
Our mission is to develop advanced cloud-based solutions that provide a clear,...

The Energy Management Challenge in 2024
How Smart Technologies Can Revolutionize Energy Grids In 2024, energy...
STAY TUNED!
Get notified of new articles