
How-to: data analysis main steps
Like it or not, we are in the era of Big Data Analytics. You can choose to look away and just trust your most skillful employee, or you could read this post (it’ll be short and sweet, promise!).
Ok then, I got your attention, let’s start with the main question: what is data analysis?
Data analysis is a set of procedures applied to a dataset with the goal of extracting meaningful information. Thus, it is crucial to stay focused on your initial data-driven question: do I need to calculate the Performance Ratio of my plant or some other KPI? Do I want to predict some incoming failure? Or maybe I want to make a forecast for tomorrow production? As in the daily life, to different goals correspond different tools and methodologies. Still, the main steps of the data analysis (see fig) are typically in common with different goals and also with different science-activities.
Data analysis is a set of procedures applied to a dataset with the goal of extracting meaningful information
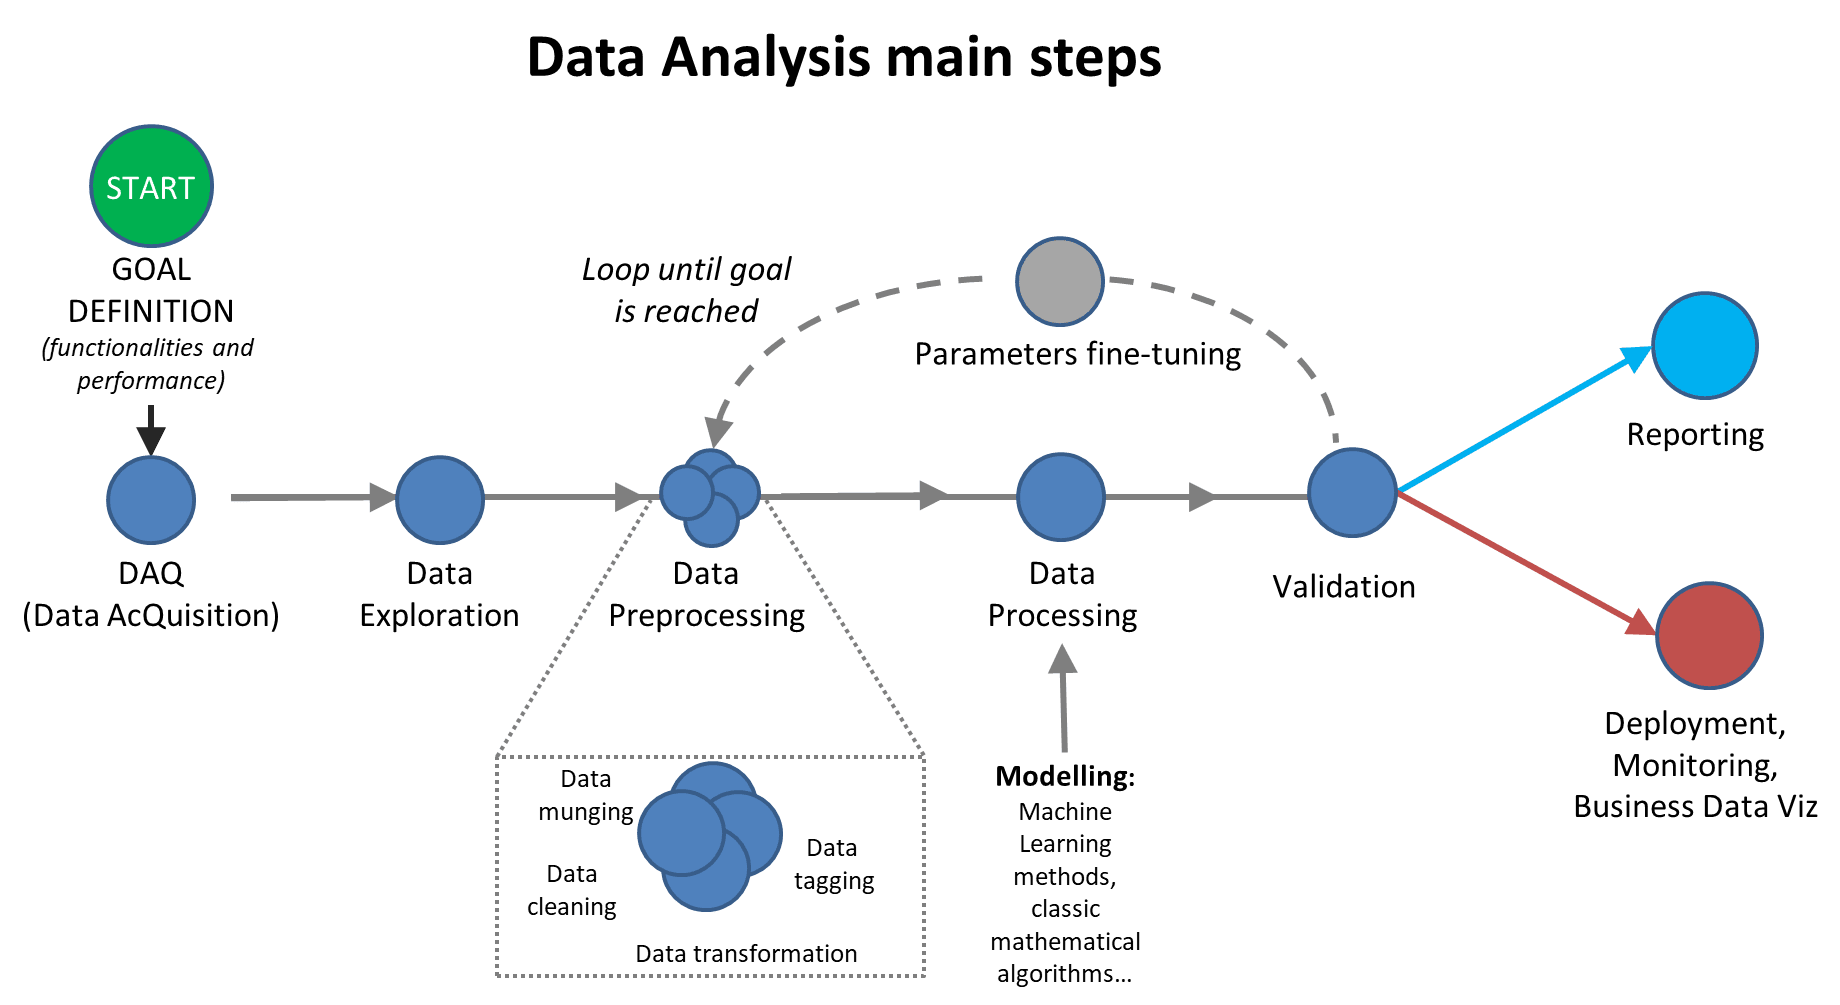
Figure 1: Data Analysis main steps.
- Goal assessment: define your goal, from the data-driven question: what do I want to do? What performances do I want to reach?
- DAQ (Data AcQuisition): acquire raw data. Where is the information (more or less) hidden?
- Exploratory analysis: preliminary understand data main features, using unconscious brain capabilities when looking at plots and graphs. How can I look at my raw data? What plots can I use (scatter plot, histogram, time-trend…)?
- Preprocessing: make order from the (typical) chaos; how can I use efficiently my data?
• Cleaning
• Munging
• Dimensionality reduction
• Feature Normalization - Modelling: what are the models that can be applied successfully to this situation? Is an AI approach feasible? Is a simpler mathematical approach better suited?
- Validation: understand if your work is reasonable and if the target performance is reached. How can I validate the results? Should I compare them with similar internal/external activities? Do I have lesson learned from literature?
- Explanatory activity: final presentation of results to further reference / sharing with colleagues /sharing with external players. How can I show you my results to help you in understanding the main points? What plots can I use (scatter plot, histogram, time-trend…)?
- Final Dissemination: presentation of results to external audience. What is the audience I’m targeting? What is the best communication approach to reach it?
• Technical/scientific publications
• Blogs/newsletters/whitepapers - Deployment: make the results reproducible and the algorithm able to run by itself for the time is necessary. How can I make the activity a permanent activity running (almost) by itself, so you will not repeat the “same” job wasting time?
- Monitoring: if the activity run by itself, how can I be sure everything is always working fine?
- Business Data Viz: make the results available and accessible to the customer.
Looking carefully, this procedure is simply a “smart” application of the scientific method, that I personally attribute to the Italian genius Galileo Galilei. In our “Big Data Analytics” era, we just made some fancy words maquillage, but the core is intact (and working well, obviously!).
At i-EM S.r.l., we think that a long journey starts from a single and smart step; also, we know that the devil is in the details, and a good procedure can help to take them into account. Try us!

For the curious costumer
At i-EM S.r.l. we have what you need (we hope!)… Try us!
Author

Fabrizio Ruffini, PhD
Senior Data Scientist at i-EM