
Goal
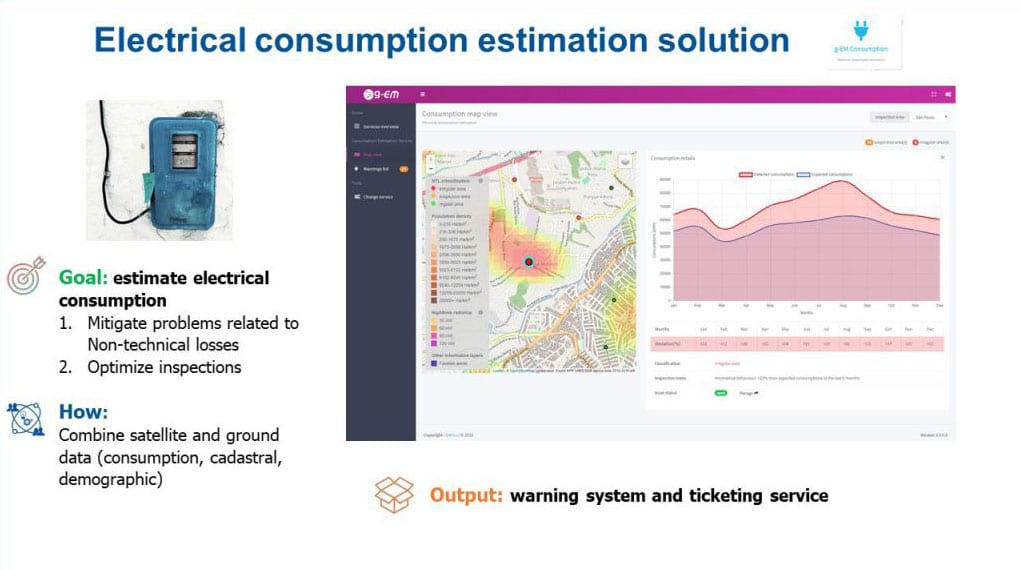
This solution is a monitoring service of the electrical consumption on the distribution grid. To avoid under-performances, we want to estimate the consumption and to identify the energy losses at building/customer premise level, thus eventually increasing the energy efficiency for electricity distribution and revenue protection for utilities.

Intro
Utility companies providing electricity to homes, factories and commercial areas have the tackle the problem of the imbalance between the energy billed with respect to the energy provided (that is, the power system losses). These losses can be due to “technical problems”, that is the electrical energy dissipated between the energy supply and the delivery points of the consumer, while the term “Non-technical losses” (NTL) typically refers to any other loss: meter malfunctions, errors in the billing process, administrative errors or intentional frauds (problem growing worldwide). A summary of the classification of power system losses are presented in Figure 1.
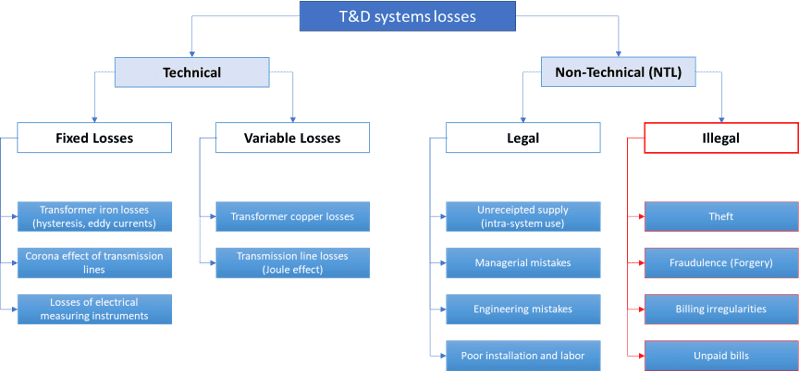
Figure 1: Losses classification on power system (“Electricity Theft Problem and Effects of Privatization Policies on Distribution Losses of Turkey.” Celal Bayar Üniversitesi Fen Bilimleri Dergisi 14.2: 163-176”, Onat Nezat, 2018).
This solution focuses on illegal causes of NTL, which is a complex area of working, because of complex workflows with limited automation, the use of basic analytics, the lack of reliable data sources in the analysis, etc.
In 2016, the 8.3% of energy across the world was lost to theft, that number become more critical in developing countries; some areas of Brazil report NTL above the 25%. This level of illegal losses can cause a reduction in the quality of electricity supply service (with a growing possibility of blackout and load shedding events), rising energy prices and significant losses on government taxes.

How
For this service, we use our expertise of Big data Analytics applied to several data sources: consumption data, space assets, open data and cadastral data, social data and demographic info. Using a Machine Learning approach, the system will look for specific behavior patterns and trigger operators’ inspections when anomalous situations are identified.
Focus on the space asset
The space asset is the VIIRS (Visible Infrared Imaging Radiometer Suite) spectroradiometer mounted on NPP Suomi satellite, passing over any given location on Earth at roughly 1:30 a.m. and 1:30 p.m. local time each day. The sensor detects light in a range of wavelengths from green to near-infrared, and uses filtering techniques to observe dim signals such as city lights, auroras, gas flares, wildfires, and reflected moonlight. As an example of application, the first image below (left) shows a natural view of night lights from the DNB of the VIIRS. The second image (right) is a data visualization of where lights went out in Panama City, Florida. In this case, a team of scientists from NASA’s Goddard Space Flight Center processed and corrected the raw data to filter out stray light from the Moon, fires, airglow, and any other sources that are not electric lights. The idea is to combine the data from the satellite sensor with the other sources described above to describe human activities in function of time, and detect anomalies.
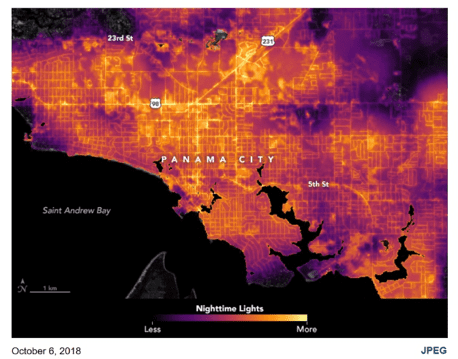
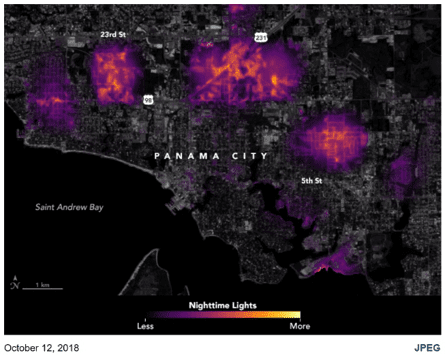
Figure 2: Night-time lights from SUOMI, analysis of blackout due to Hurricane Michael, ref https://earthobservatory.nasa.gov/images/92887/lights-out-in-michaels-wake.
The output
The output of this system is a monitoring service, with ad hoc reporting capabilities. Reports are additional inputs for the integrated ticketing service. An overall schema of the system is shown in next figure.
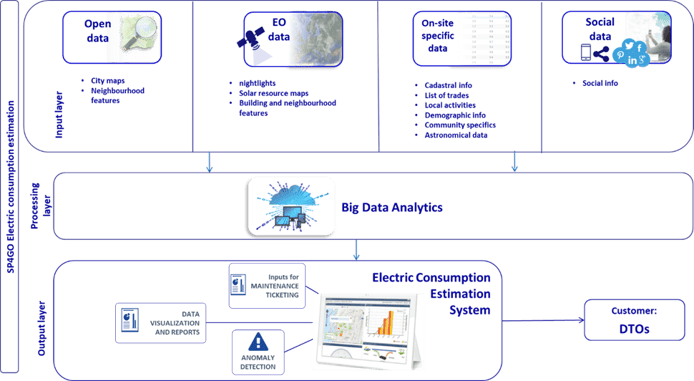
Figure 3: Consumption monitoring system schema.
Let’s have a look!
The user can easily access service information from the map view page where a comparison of the night-time radiance acquired in two different years (i.e. 2018 and 2019) over Sao Paulo in Brazil and Rome in Italy.
It is possible to move quickly from one city to the other one, by changing the value of the combo selector “Inspection Area” positioned in the top right corner of the view.
A swipe control allows the user to easily compare the 2 radiance layers in all the part of the map view rendered.
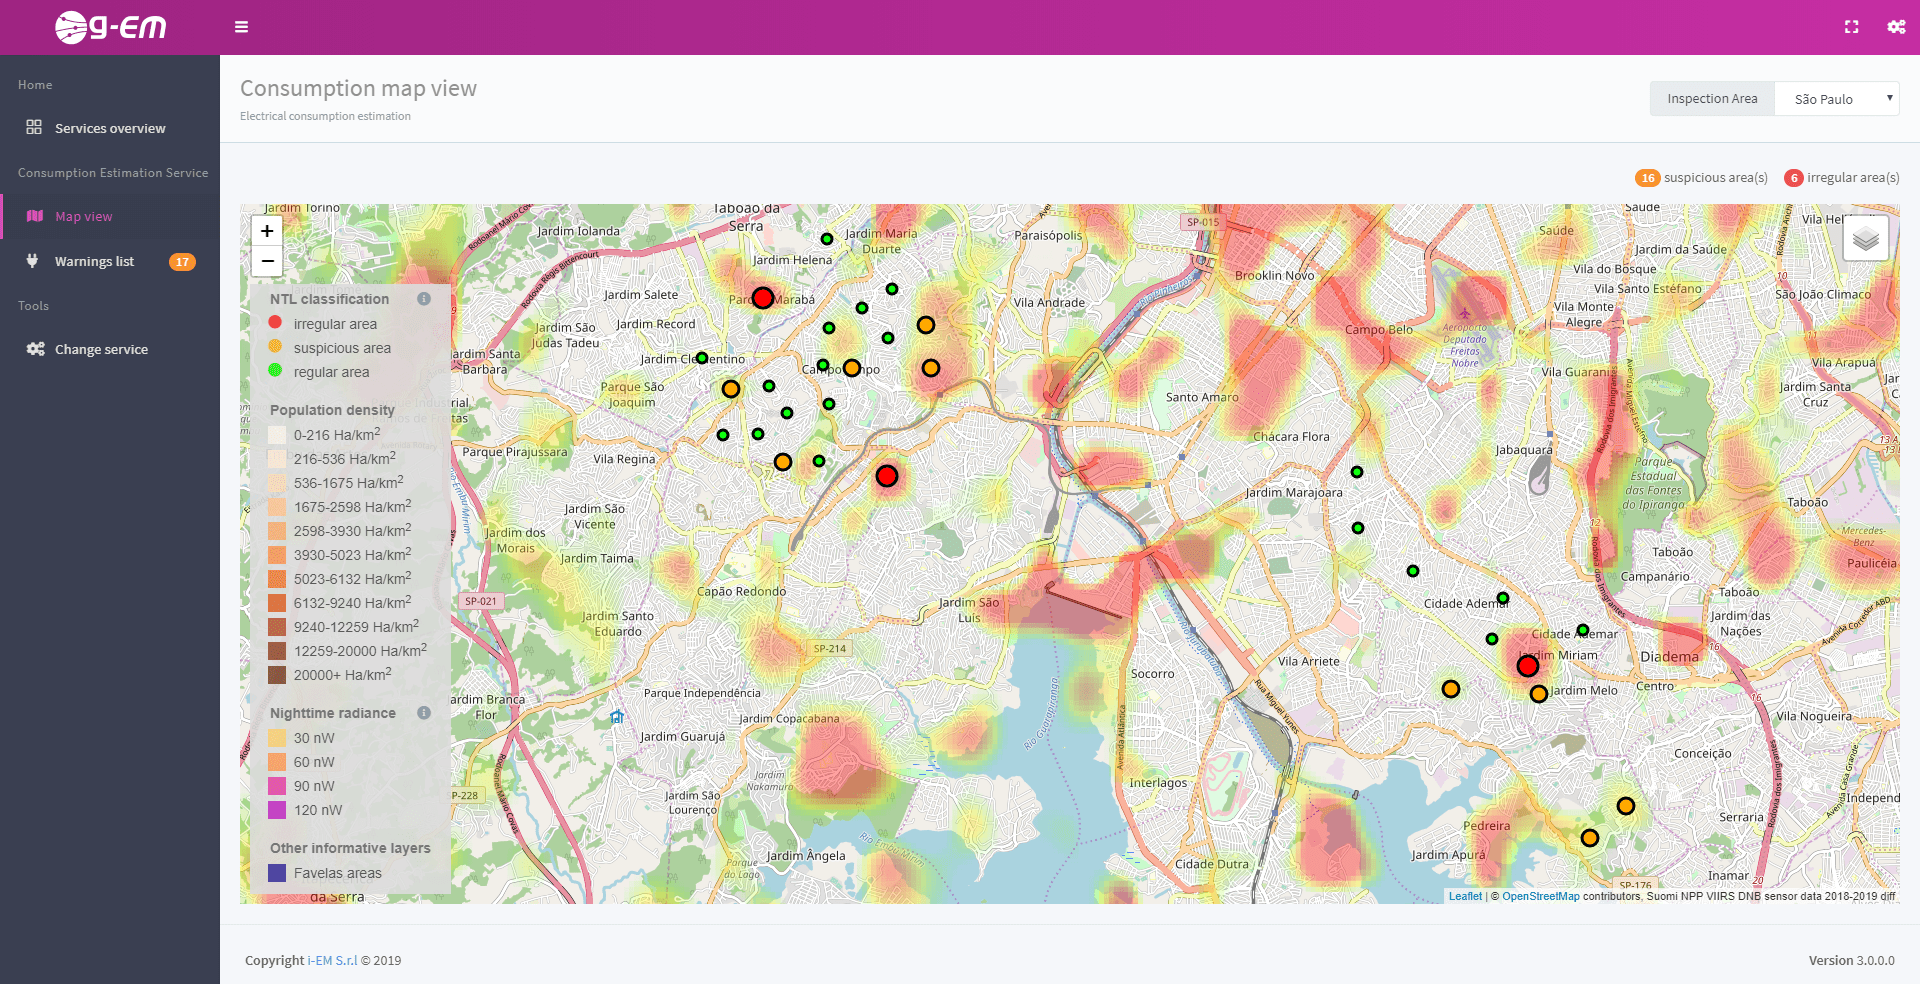
Figure 4: Consumption map view.
Colored circle markers are positioned on the map in correspondence with an inspected area.
A green circle indicates an area with electrical consumptions in agreement with the expected values. A yellow or a blinking red circle reveal, respectively, a suspicious or an irregular area where anomalous electrical consumptions are detected.
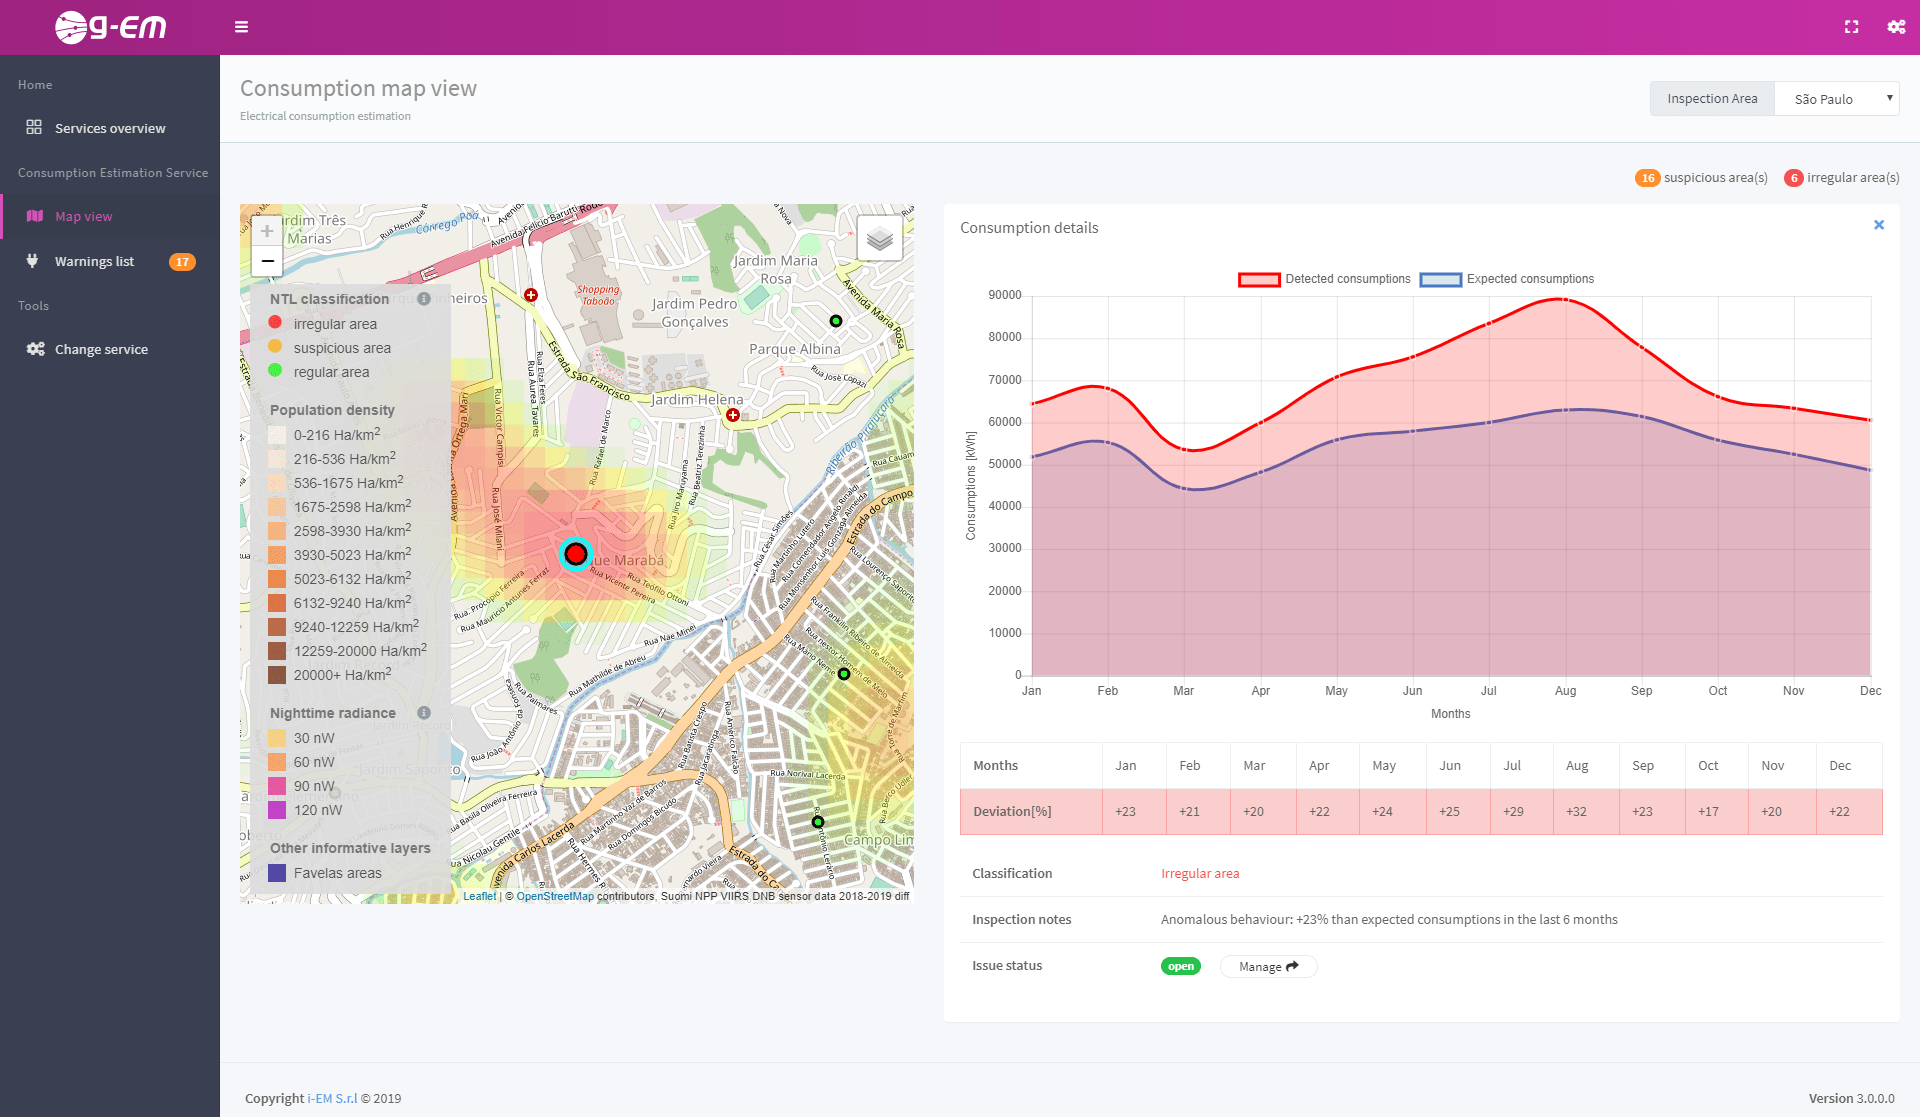
Figure 5: Consumption details.
By clicking the map on a circle marker, a side panel appears showing the consumption details (a time chart and a differential table) over the last year for the related area. The area classification on the consumption behavior basis is reported in the second part of the info panel together with a short descriptive report of the inspection.
At the top of the map the user can change the level of information to be displayed:
ESRI World Imagery or Sentinel Imagery as basemap, Population density per district and Favelas boundaries (for Sao Paulo only) as overlays.
The output of this service is a visual information about areas affected by anomalous consumptions in order to support the operator to identify the energy losses.
By clicking the “Warning list” menu item on the navigation panel on the left side, the list of all anomalous consumption detection issues is shown. Every issue is supplied with detailed info about the current operative status (e.g. Open, Pending, Closed, Unassigned), the priority, the issue assignee, the description, the issue creation date and the classification of the involved area (e.g. regular, suspicious, irregular). This is a preliminary version of the ticketing platform for the Consumption service.
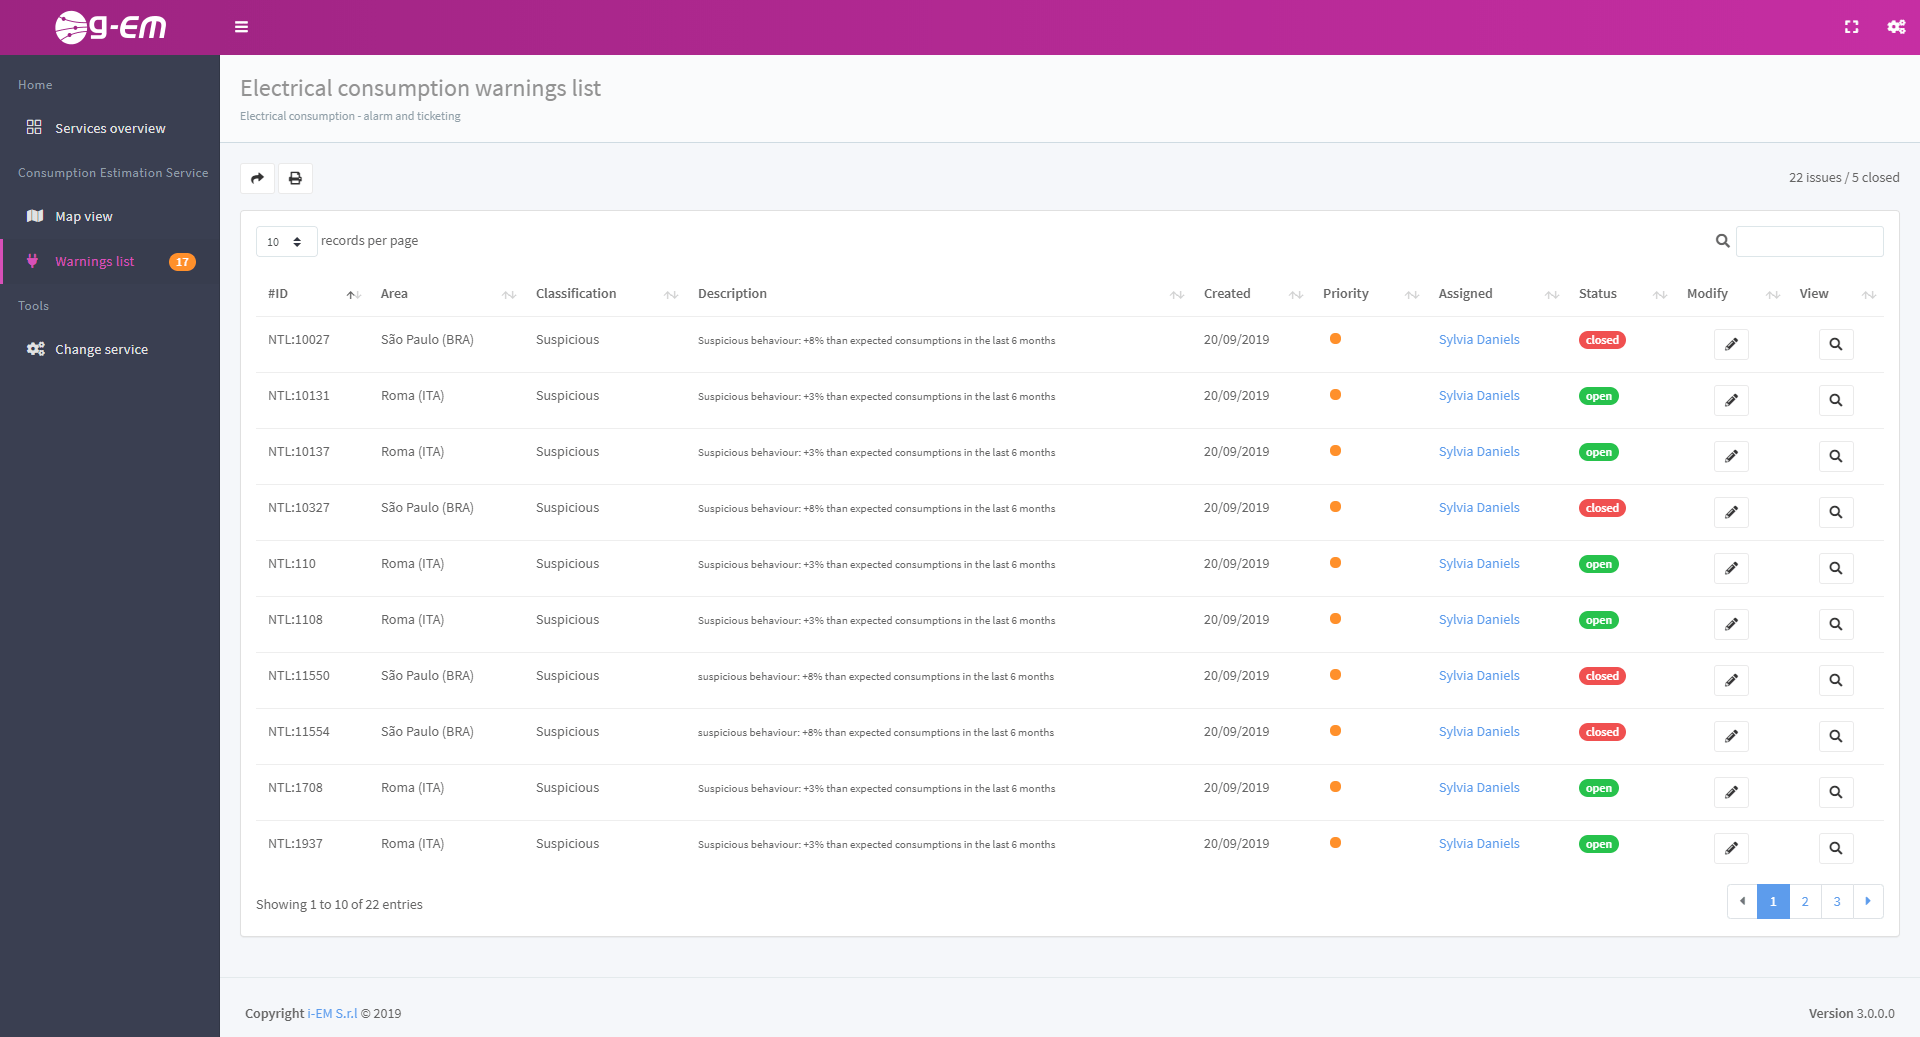
Figure 6: Consumption ticketing service.
Involved technologies
Earth Observation, Satellite navigation, Big Data Analytics, Open Data, Artificial Intelligence.