
Data analysis eighth step: deployment
The road so far
So, you started with a goal, you found some related datasets, pre-processed and processed them, and now you got results. You validated, fine-tuned them
… and now you are ready to deliver them to the customer… there we are! Almost at the end of the journey!
The road ahead
The delivery to the customer can be made in different ways. In my opinion, to give a delivery with a reasonable quality, you’d have to consider three final pieces: deployment, monitoring, Business DataViz.
Deployment
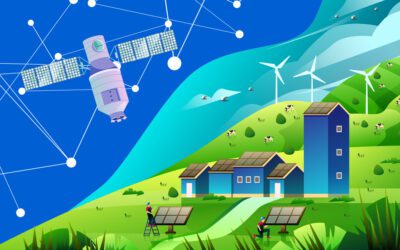
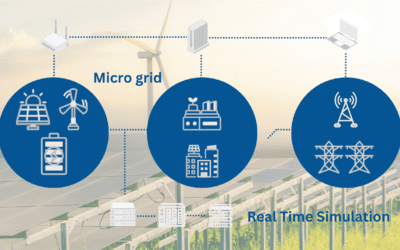
Allow me to simplify (I’m a physicist, it’s my favourite hobby!) and schematize, and define as deployment all the final activities needed to provide some outputs to the customer with a fixed frequency. Of course, this depends on the specifics features of the activity. For example, let’s take a real-world example of a monitoring platform for solar photovoltaic plants (ah, incidentally, this is also one of our core business services… what a coincidence!
The monitoring platform is based on input data from photovoltaic-plant SCADA systems, enriched by i-EM expertise in Big Data Analytics. The front end is based on an internal Infrastructure as in the general i-EM schema; in this case, we decided for a Software as a Service approach.
We have three final pieces: deployment, monitoring, Business DataViz.
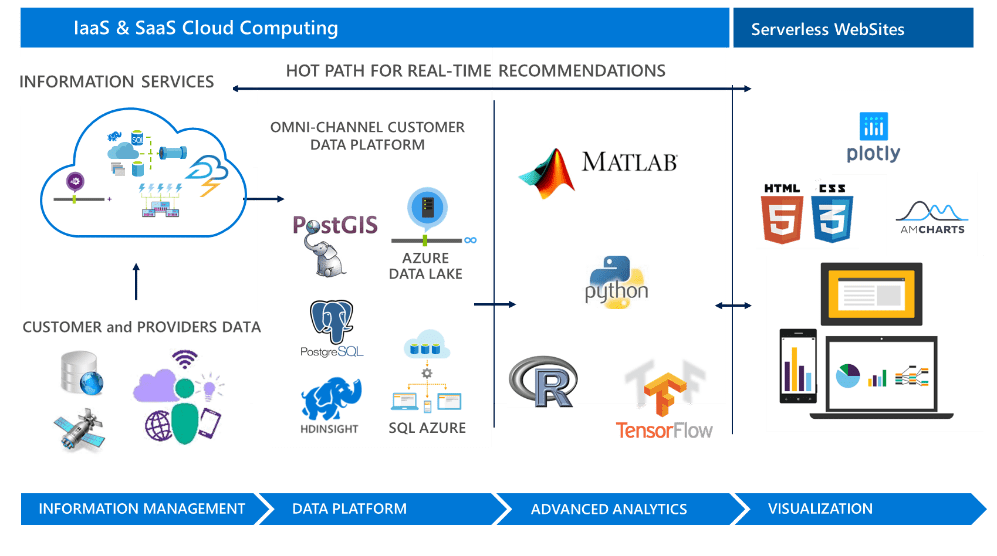
Figure 1: i-EM IT infrastructure general schema
This is a quite high-level approach, and there are many others depending on the customer needs.
Monitoring
Let’s say that the deployment piece is the engine of the whole delivery to the customer. Then, you would need some kind of sensor to monitor the correct functioning of the engine to avoid problems and, even, penalties (for example, in contracts where you ensured a 99% of correct deliveries).
Thus, an internal monitoring system invisible to the customer, would be a very good idea. In i-EM, we created a system called “Monitoring Room”. The goal is to be able to detect in time anomalies in the delivery and act before the customer gets a low-quality service.
Business DataViz
Finally, in some cases you’d like to show all your hard work to the customer in a fancy and user-friendly way. Extracting essential data from a dataset and displaying it is necessary so that customers can make correct decisions based on data. So, a business data visualization approach is what you want. A good business data viz platform should change the way the customer works, allowing him to get fast and easily the insight needed for the business decisions.
Real-world example
As an example of Deployment, Monitoring, and Business DataViz take s-EM.
In i-EM, we deliver a solar energy monitoring (s-EM) platform trough SaaS. It is a Web-based software ensuring users to access PV plant portfolio data whenever they are. Simply logging-in a web site!
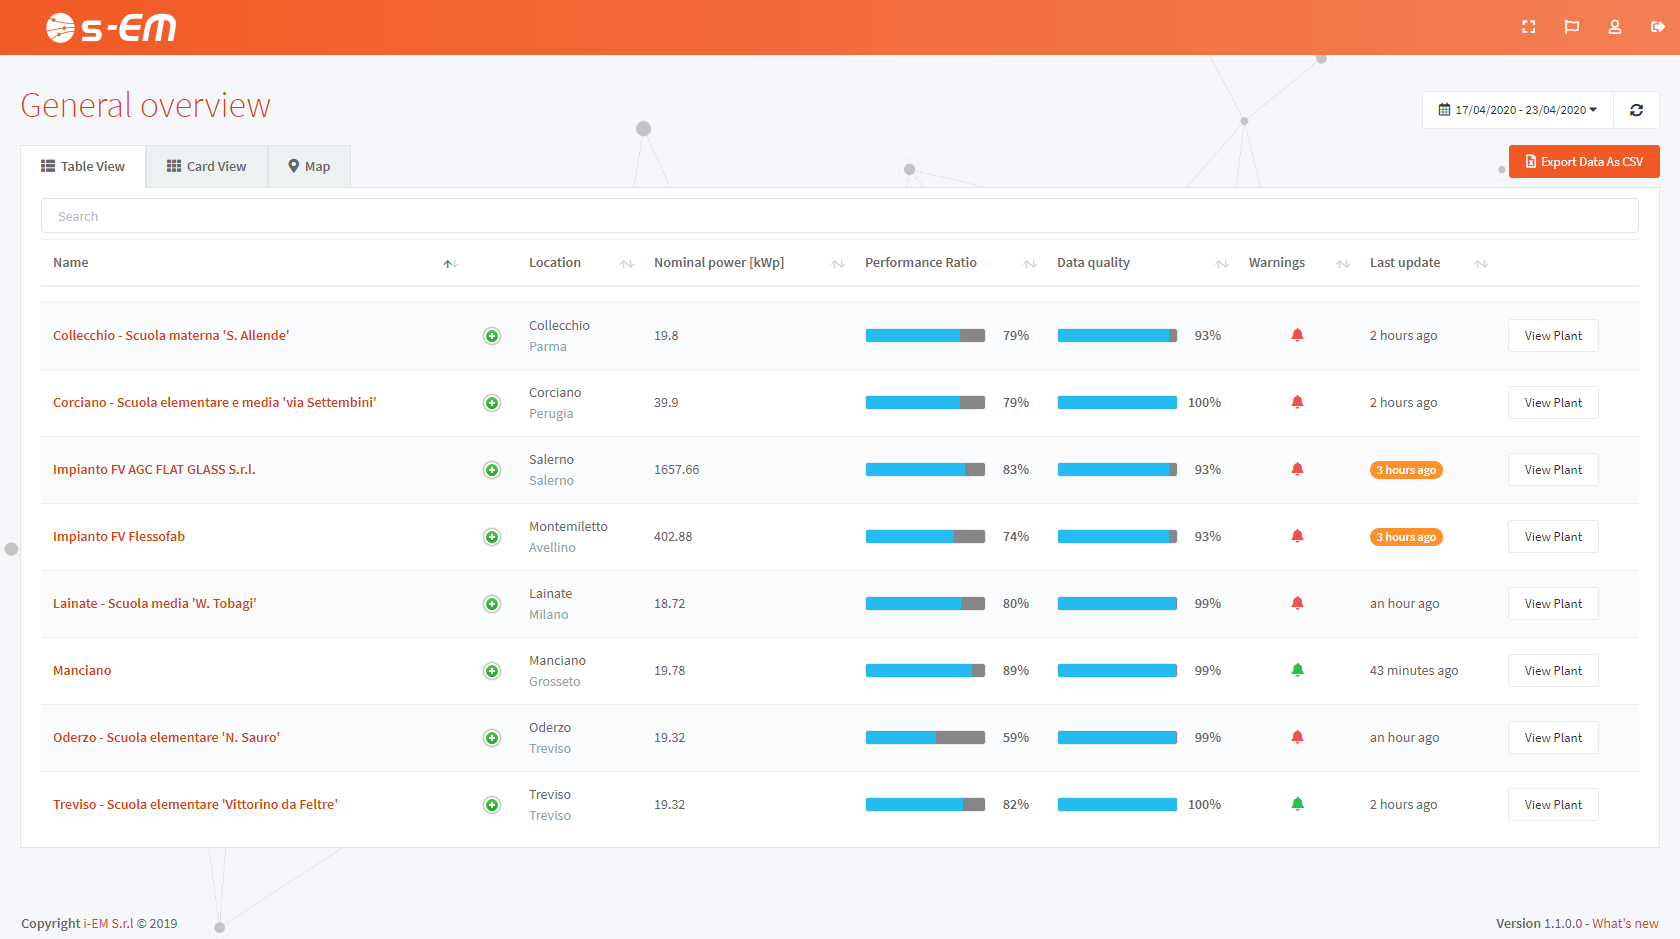
The s-EM system also delivers service like instant SMS and e-mail to timely aware Field Technicians about any warning which affect PV Plant production and cause economic losses.
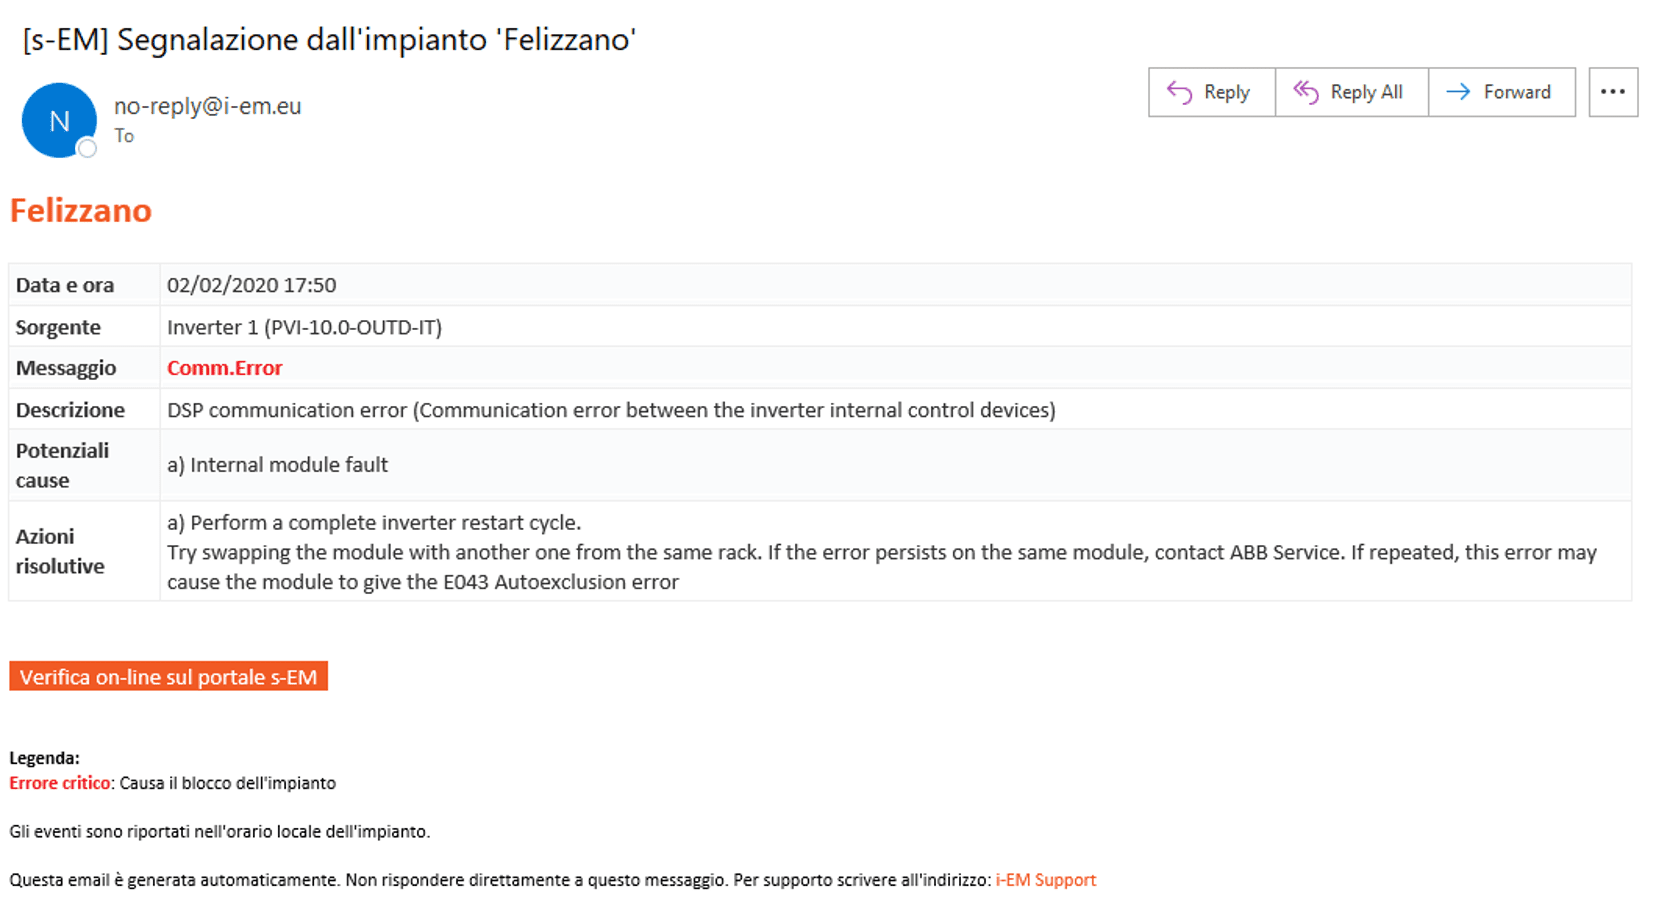
Monitoring such service is of importance to keep the Service Level Agreement. Keeping SLA over 99% of correct delivery requires automatic monitoring of the service. i-EM technical support staff can benefit from the data acquisition devices supervision system which automatically produces information of any device outages, let them efficiently and proactively support customer.
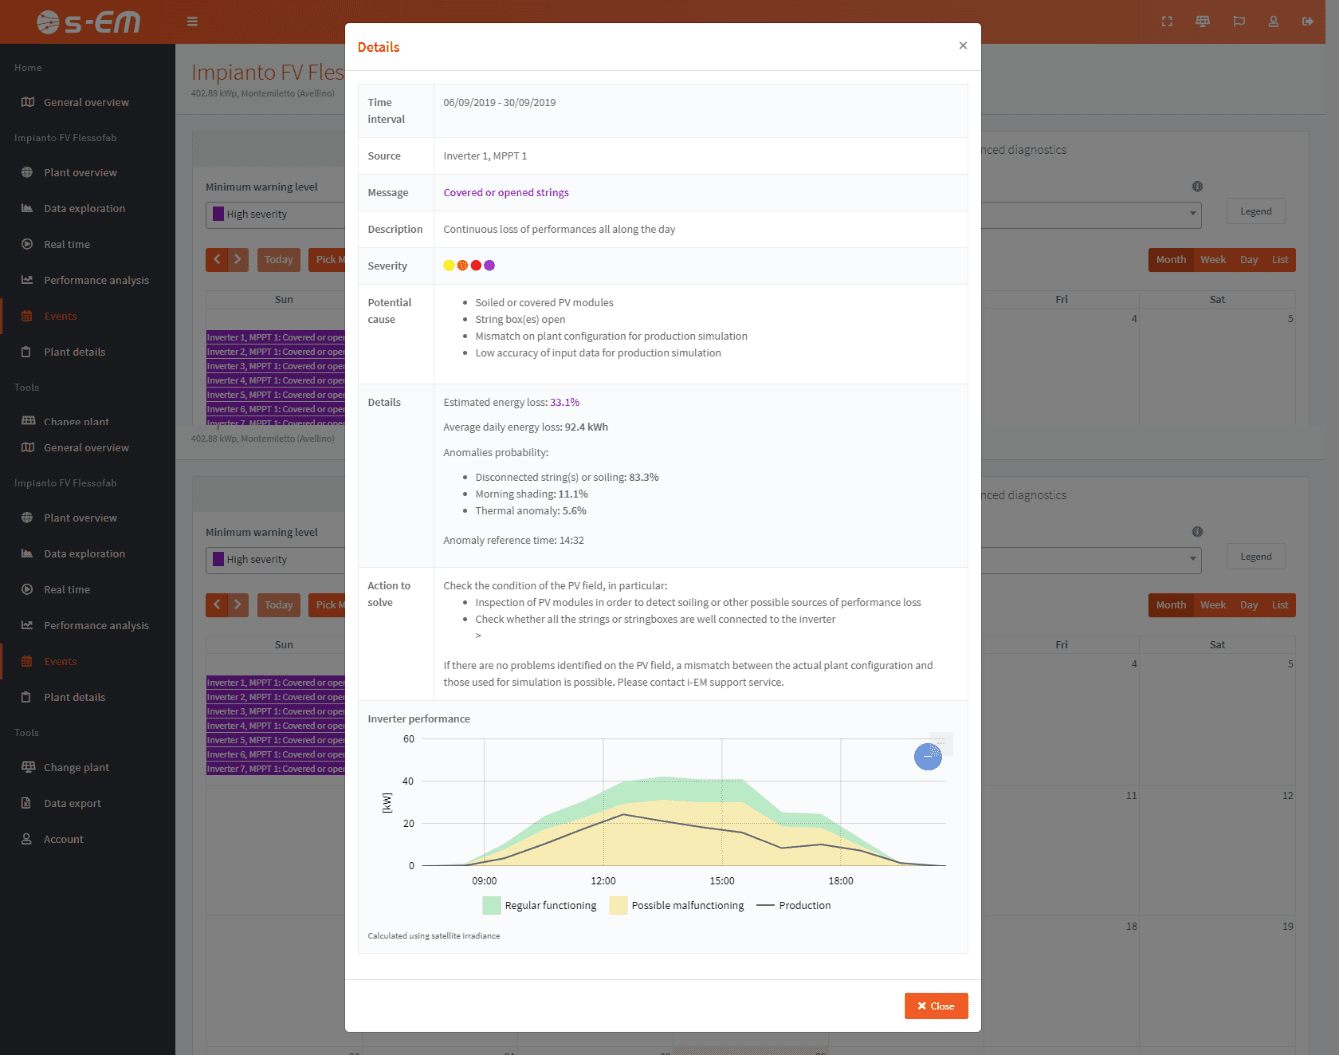
Finally, Dataviz! s-EM platform allows customers to get fast and easily insight needed for the business decisions. KPIs, highly interactive charts, data quality assessment, performance analysis, advanced diagnostic, events management are just some functionalities users can benefit.
And do not forget! This is the result of the Data Analysis journey followed step by step. As described so far!
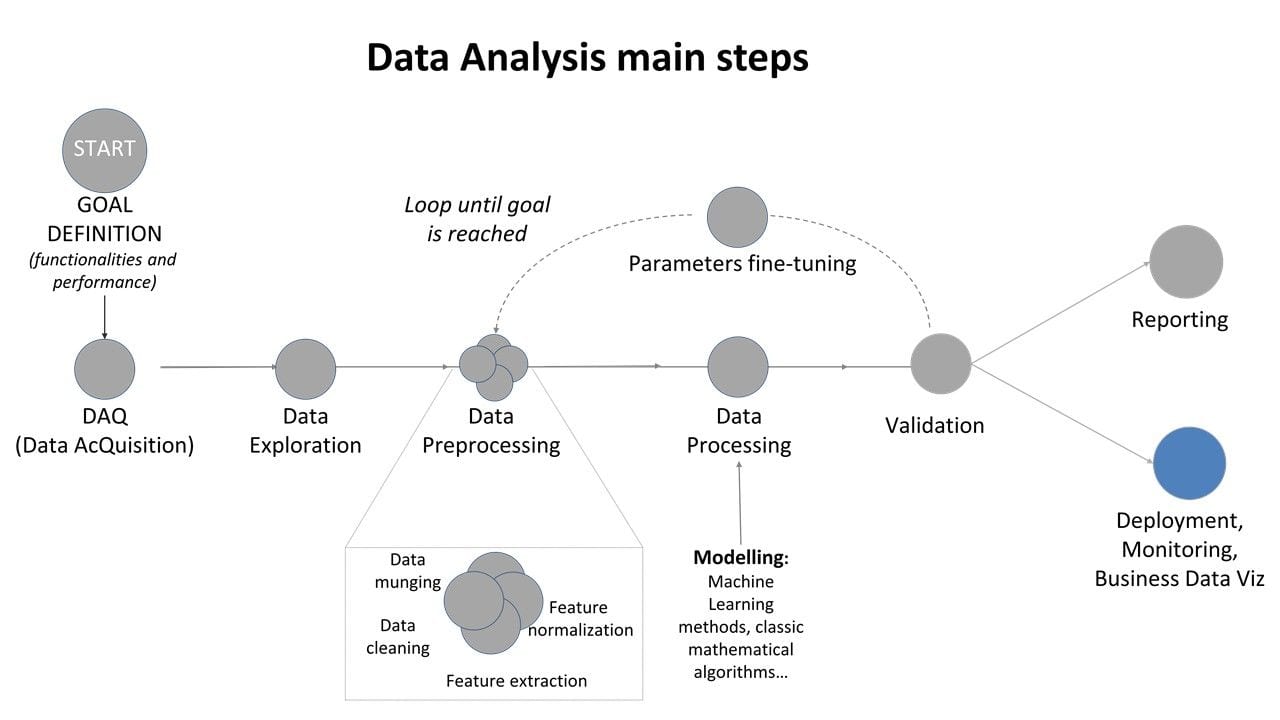
Figure 2: Data Analysis main steps: focus on deployment
Useful and most used tools
R, SAS, SPSS, python, Julia, RapidMiner, MatLab, Weka, Scala, ROOT (Cern), Knime


For the curious costumer
At i-EM S.r.l., we think that a long journey starts from a single yet smart step; also, we know that the devil is in the details, and a good procedure can help to take them into account.
For the keen reader
Some further readings I found interesting (not so much as my post, sorry for you…)
- Complete Guide to Data Visualization with Python: https://towardsdatascience.com/complete-guide-to-data-visualization-with-python-2dd74df12b5e
- 15 Stunning Data Visualizations (And What You Can Learn From Them): https://towardsdatascience.com/15-stunning-data-visualizations-and-what-you-can-learn-from-them-fc5b78f21fb8
- How do we know when a visualization is good? Perspectives from a cognitive scientist: https://medium.com/multiple-views-visualization-research-explained/how-do-we-know-when-a-visualization-is-good-c894b5194b62
- How to design effective data visualisations: https://medium.com/empathyco/how-to-design-effective-data-visualisations-2008ce1cd9a7
- Best Data and Big Data Visualization Techniques: https://medium.com/sciforce/best-data-and-big-data-visualization-techniques-e07b897751dd
- Multiple views on how to choose a visualization: https://medium.com/multiple-views-visualization-research-explained/multiple-views-on-how-to-choose-a-visualization-b3ffc99fcddc
Author

Fabrizio Ruffini, PhD
Senior Data Scientist at i-EM

Lorenzo Gigoni
Technical Sale Engineer at i-EM