
The road so far
This is the second post regarding data analysis, focused on goal setting.
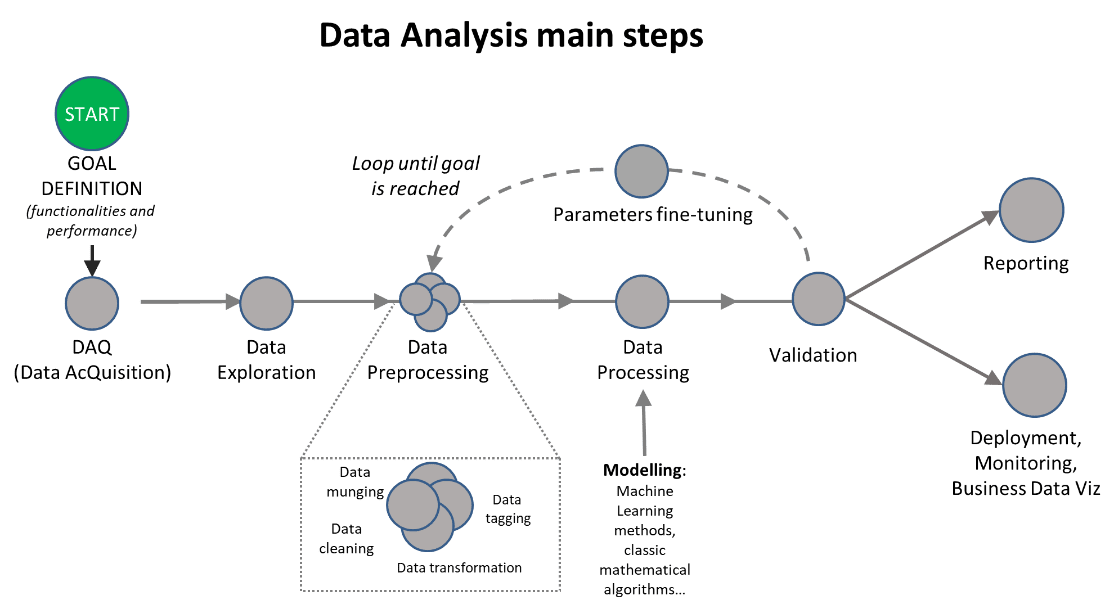
Figure 1: Data Analysis main steps.
So far, so good
So, you have a question. It can be a business or a technical problem, does not matter as long as you can identify it. Actually, here is the 80% of the problem: you need to state the problem very clearly and without ambiguities, if you really want to solve it.
A list of questions can help you in finding the way:
- What do I want to accomplish?
- For what reasons?
Up to here, we are in a “qualitative area”. These questions are fundamental and are the basis for the building, but you need to add the roof: that is the “quantitative area” questions:
- Can I state it as a numerical question?
- How can I calculate it? Do we already have a function, a KPI, a variable addressing the numerical question? If we do not have it, can we design it? Also, you can change it while going on. The point is to try to define it (at some time, you will also succeed ?!).
- What is the accuracy and/or the tolerance I envisage for that numerical result? Can I use standard statistics such as relative errors, absolute errors, RMSE, NMAE… Also, you could be the first to try to assess the accuracy, or that, at first, you do not have a clear idea on how to assess it. That’s not the point, the focus is to keep it in mind (and have it ready) by the end of the activity: if your result turns out to be 5 with an error of 200%, you should not feel very proud of your approach…
- Once I have the final result, how can I validate it? Do I have some hints looking at literature? Do we have in our team similar activities so to compare results?
- Do I have the technical tools to calculate it?
- Do I have the time to meet expectations? Deadlines are always coming!
- Can I ask for a double-check to someone I trust? (please, do not re-invent the wheel: they already did it some time ago!). If possible, ask someone you trust to double-check even your initial assumptions, not to fail just at the beginning.
Let’s give some examples on solar activities
- Basic example: calculate your plant performance using the PR
- “Advanced” example: power forecast of your plant
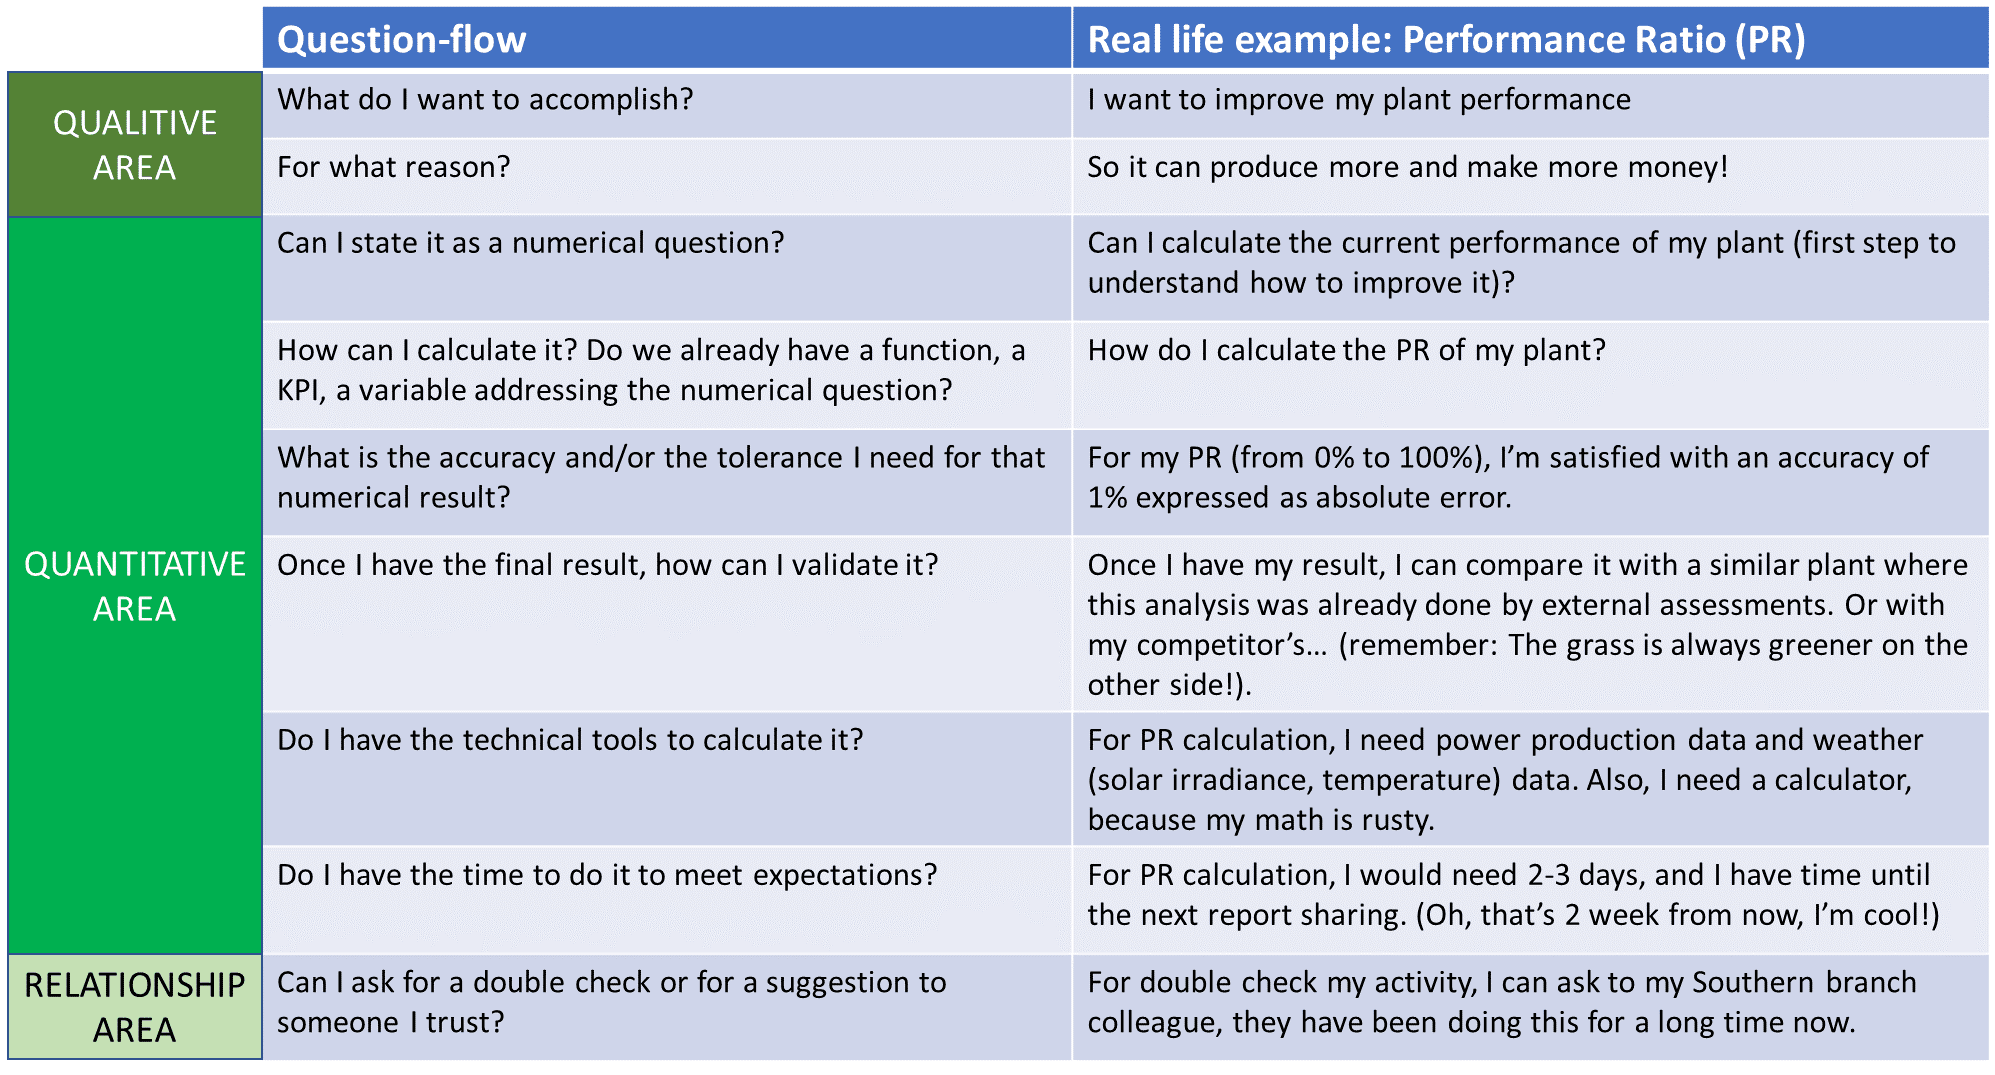
Figure 2: example 1: do I improve my plant performance?
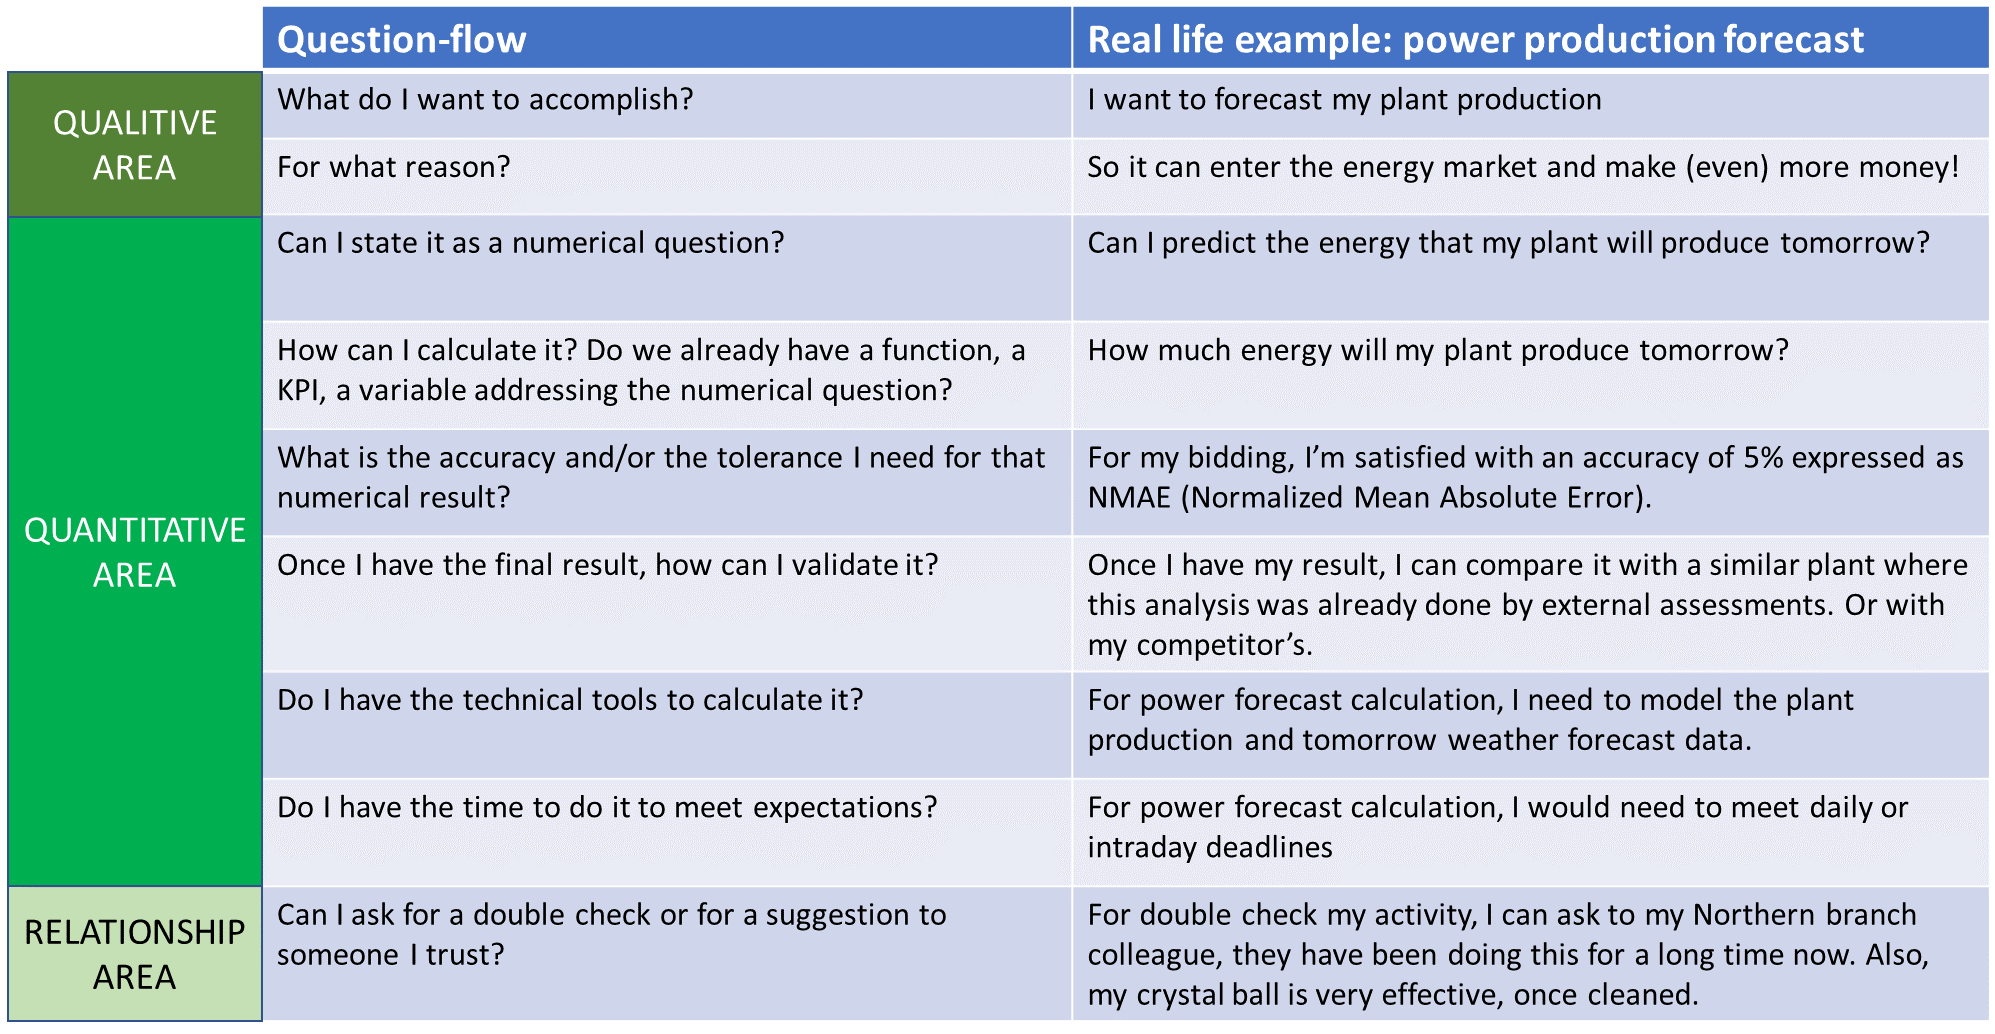
Figure 3: example 1: do I forecast my plant production?
If you want me to use some fancy words, I can say that we are essentially rephrasing the SMART goal setting approach (specific, measurable, agreed, realistic, time-phased) in the data science context.
Now, you are ready to go: what is your question…? Do you already have a KPI answering the question…? How do you calculate it?
i-EM at Work
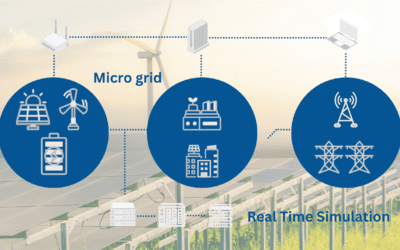
i-EM provides advanced big data analytics powered solutions for intelligent energy management, enabling the optimization of energy decision making for Solar, Wind and Hydro plants and for e–Mobility, Smart and Micro grid. All company services embrace the value of the data analysis process, from analytics to data visualization to better give all the elements and forecasts information useful to make the optimal decision.
Get the best from your data.
Below, six innovative data analytics strategy for each energy asset:

h-EM provides data analysis for hydro.
Create more value from data, through big data analytics, Machine Learning and Artificial Intelligence. From data quality check to efficiency analysis to improve the service output in Hydro plants.

s-EM provides data analysis for solar.
Get the true value of data and use them properly. The suite of i-EM solar solution increase yield and decrease operational costs, maximising performances with different services: power forecast, predictive maintenance, smart monitoring, sensor check, satellite-based plant construction monitoring and UAV data management.

w-EM provides data analysis for wind.
Keep optimal performance, creating more value from data exploiting big data analytics, machine learning and artificial intelligence technologies. Wind turbines continuous monitoring and real-time failure prediction.

g-EM provides data analysis for grid management.
The innovative analytics decision support system for improve the management of the grid is empowered by satellite communication and Earth observation.

m-EM provides data analysis for microgrid management.
Advanced analytics works with the strategic complicity of the exploitation EO satellite data and SatCom links to efficiently manage urban and rural microgrids.

eV-EM provides data analysis for e-Mobility.
i-EM data analysis ensures benefits to all the electric mobility actors. Advanced analytics process works to get smart balancing, energy charging & routing and charging points planner
GET IN TOUCH NOW
If you would like to learn more about us, to ask for any information or get further details about our work in i-EM, write to us or come meet us.
For the curious costumer
At i-EM S.r.l. we have what you need (we hope!)… Try us!
Author

Fabrizio Ruffini, PhD
Senior Data Scientist at i-EM