

Data analysis sixth step: data validation
The road so far
So, you started with a goal, you found some related datasets, preprocessed and processed them, and now you got results.
Are we (really) done? Not at all ?!
The road ahead
As said in the very first post, the Validation step goal is to understand if your work is reasonable and if the target performance is reached. The questions are: How do I validate the results? Should I compare them with similar internal/external activities? Do I have lesson learned from literature?
Thus, there are several questions to keep in mind: which are the models that can be applied successfully in this situation? Is an Artificial Intelligence approach feasible? Is a simpler mathematical method better suited?
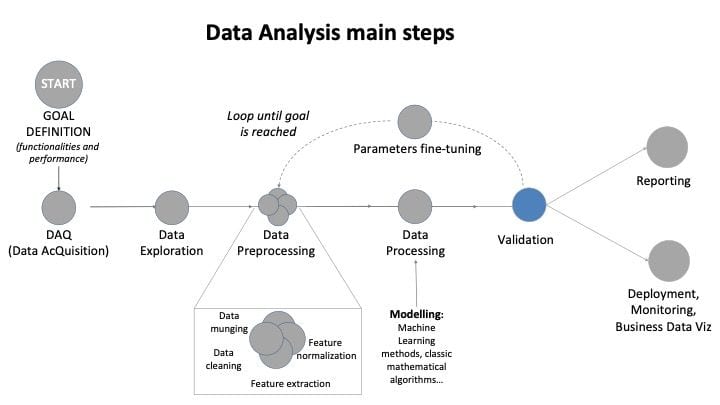
Figure 1: Data Analysis main steps: focus on data processing
That is, before the processing step, even before thinking at the model to be used, you need to have a (preliminary) idea on how to validate it.
Schematically, I suggest three areas of validation.
The most intuitive one is a “statistical area” validation:
You certainly know evaluation metrics such as MAE, bias, relative errors, RMSE, MAPE, Kolmogorov-tests, Confusion Matrix specificity, sensitivity, precision, Likelihood Ratio, chi-squared tests… they give you a quantitative score of the goodness of your results. There are a lot of them, and you would probably want to use the ones that are typically understood and easily interpreted by the “audience” of your results.
The second is the “systematic area” validation:
Usually, you have a-priori knowledge from literature or from previous similar works: results, considerations, best practices. You can use this kind of benchmark to compare your results with reasonable expectations. However, especially if you are doing something innovative, maybe there will be no similar results. In this case, you’ll always have the final and most powerful validation final technique.
The final validation technique is the “cum grano salis” technique:
Look at you results and use your common sense, that is just the gut-feeling you have from the experience accumulated through your time-over-time hard work. If something seems fishy, even if you cannot explain why, an additional check is not a bad idea.
At the end of the validation, hopefully you will have your results and some kind of uncertainty associated. Now the next question is: are this performance good enough to answer my initial question? If not, go on with the fine-tuning step. If you are good with your performance, go on with final dissemination and deployment.
Please note: if you have no idea on how to validate the results of a particular model, you should change the model, because you are not able nor to interpret nor to defend it, nor to explain them, nor to re-use them: you just get results, but you really do not know how and why. So, next time, you have no idea if your old model is going to work, and with what kind of performance.
Lesson learned become tip and tricks!
- Be communicative and precise: if you are using the NMAE without night-hours as a score function, say it. Otherwise, the people you are talking to (customers/colleagues…) will not be able to understand if your results are reasonable or not. Typically, everyone will think at his “preferred” score function and use it as comparison. You would be misunderstood, and you have to repeat everything again.
- Consider who you are talking to: if they are accustomed to use a specific score function (let’s say, the relative error), they will have difficulties to compare it with a different one (lets’ say, the MAE) to understand if your results are good or not so good.
- Remember the difference between errors and their meaning. For example, from a user’s point of view, mean absolute error (MAE) is appropriate for applications with linear cost functions- i.e., when the costs caused by a wrong forecast are proportional to the forecast error. RMSE is more sensitive to large forecast errors and hence suitable for applications when small errors are more tolerable and larger errors cause disproportionately high costs, which is the case for many applications in the energy market and for grid management issues. [1]
- If comparing two approaches: The dataset used are exactly the same? If not, I DO understand the reason?
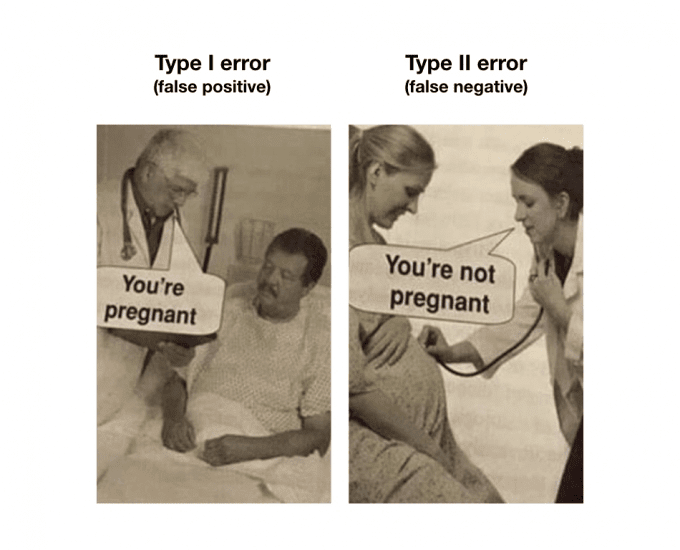
- Remember: some misunderstandings can be very relevant, as in the figure below!
Real-world example
As an example, let us take the Performance Ratio calculation for your photovoltaic plants. The model is quite simple, it is just simple math, and everybody knows that the higher the PR, the better. Question is: what is the value you would expect from your power plant? For example, you could take the previous year PR, and look at the comparison, if the weather conditions were similar. If the difference is much greater than the 1% expected decrease, you could consider investigating deeper. Or you could compare you PR with some external reference; in this way, you would be able to understand if there is a very large problem in your internal data processing. For example, in Italy you could take PR values from the “Gestore Servizi Energetici” GSE, as in the following table, and compare it with yours (see interactive plot for an example of i-EM monitored PV plants). Again, if the discrepancy between your value and GSE values are too large, there could be a problem somewhere.
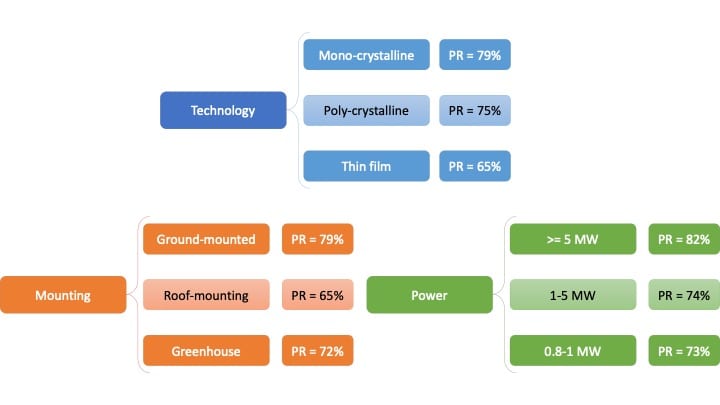
Figure 2: 2017 Performance ratio analysis of Italian PV power plants, source: GSE
Notes
[1] Sengupta et all, “Best Practices Handbook for the Collection and Use of Solar Resource Data for Solar Energy Applications: Second Edition”, NREL, Technical Report NREL/TP-5D00-68886 December 2017. (See reference)
For the curious costumer
At i-EM S.r.l., we think that a long journey starts from a single and smart step; also, we know that the devil is in the details, and a good procedure can help to take them into account.
For the keen reader
Some further readings I found interesting (not so much as my post, sorry for you…)
- ANALYZE TEST DATA IN 6 STEPS: http://moore-english.com/analyze-test-data-in-6-steps/
- 7 TOP WAYS TO IMPROVE DATA ACCURACY: https://www.outsource2india.com/DataManagement/articles/ways-to-improve-data-accuracy.asp
Author

Fabrizio Ruffini, PhD
Senior Data Scientist at i-EM