Measurement uncertainty: some words on error theory
The idea
When you buy a new instrument, for example a pyranometer, or a dataset, for instance from satellite-based imagery, you want the best (according to your needs). The provider could tell you: “Take this! The resolution is top-level!”. “But is it accurate?” “Yes, the systematic error is quite small!” “And about the precision?” and you can go on like this for a little while, always thinking in your mind: “Is this just bla bla bla… or there is something more, and I should really pay attention?”.
The right approach is trying to understand the main source of uncertainty, and how it impacts on your initial goal.
The road ahead
In this post we will try to make clear some of the most used terms. In particular, the difference between accuracy, resolution, precision, uncertainty, systematic error and statistical error.
Some boring… important notions
When reporting the result of a measurement of a physical quantity, to give some quantitative indication of the quality of the result is really important, so that those who use it can assess its reliability. Without such an indication, measurement results cannot be compared, either among themselves or with reference values given in a specification or standard. It is, therefore, necessary a readily implemented, easily understood, and generally accepted procedure for characterizing the quality of a result of a measurement, that is, for evaluating and expressing its uncertainty [see Ref 1].
The question is: after you have done a measurement, how well the result of the measurement does represent the value of the quantity being measured?
My feeling is that people often use accuracy, uncertainty, sensitivity, precision as synonymous, depending on the expertise area and on the internal “traditions”; thus, a clean, organic, and rigorous set of definitions would help people in correctly use the terms.
Fortunately the Joint Committee for Guides in Metrology (JCGM [1] spent a lot of effort to make order and clarity to create two guides):
- The Guide to the Expression of Uncertainty in Measurement (GUM) is a document published by the JCGM that establishes general rules for evaluating and expressing uncertainty in
- The International vocabulary of metrology(VIM) is an attempt to find a common language and terminology in metrology, i.e. the science of measurements, across different fields of science, legislature and commerce.
The documents were written coordinating experts from different fields and entities, to ensure a large and shared common ground [2].
The GUM document, available here, contains all the information to understand how the answer to the question “How good is my measurements”?
In this post, we will clarify some key points, and then we will report some commonly used terms.
Key points and commonly used terms
In my opinion, there are two main points:
The first is to correctly use the terms. The most important one is how we will use the term “uncertainty” [3]: form here on, it will be the general term indicating our doubt about the result of a measurement.
The second is interiorizing the difference between errors due to statistical fluctuations of the measurements and the ones not related to them.
The first area is commonly referred to as “statistical uncertainty”, and to quantify it you usually use the term “statistical error”. It is the error related to the fact that the quantity you are trying to measure is not constant in the time interval you are measuring it, and when you repeat the measurement you have different results not due to the instrument goodness (let’s assume you have a perfect instrument) but to the nature of the quantity.
For example, if you are trying to measure the number of electrons going throw a section of a wire in a fixed amount of time.
The second area is commonly referred to as “systematic uncertainty” [4], and to quantify it you usually use the term “systematic error”.
Daily life example: what’s your weight?
In statistics, a common-life example is worth a thousand words: when you measure your weight, there is no statistical fluctuations if you repeat the measurement in a time-interval where your body does not change (let’s say, order of minutes). Even if you go up and down the weight scale, the number will not change (in particular, it does not decrease ?). So, can you read the number and just say: “My weight is 72 kg”? If you followed this post, of course you would say “no”. We should say “my weight is (72 ± some_error) kg”. The error, in this case, is the systematic error, and it is the quantitative answer to the question “how good is my weight scale?”.

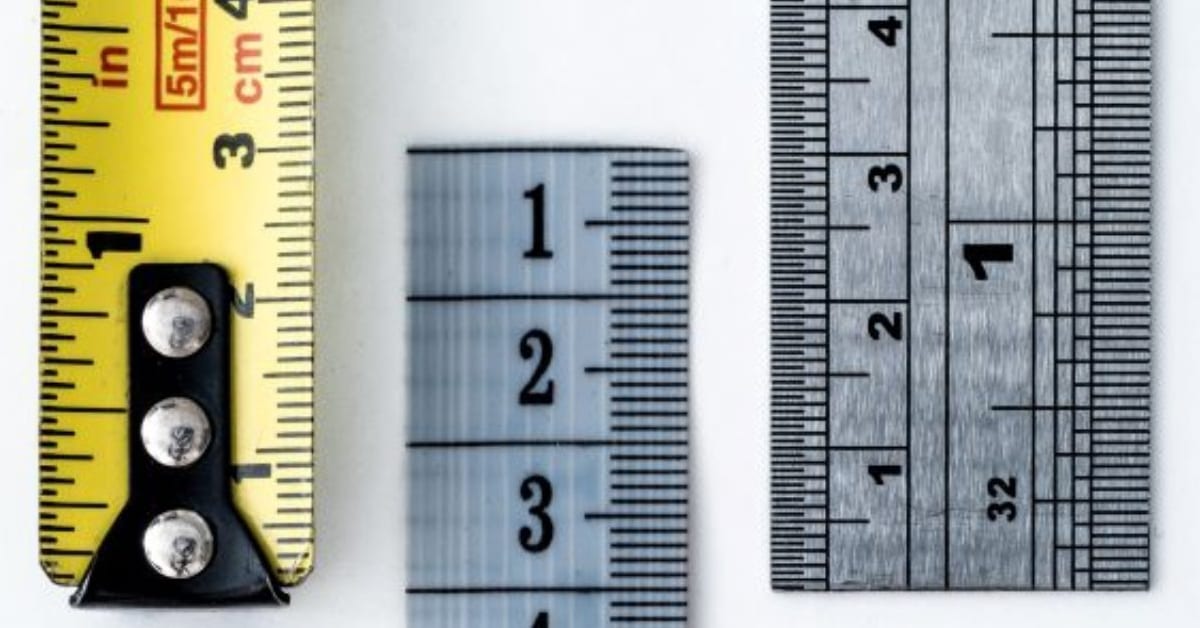
Generally, this can be assessed as the sum between the resolution of the instrument and its accuracy. The resolution is the minimal perceptible change in the instrument reading. For instance, a typical digital weight scale has a resolution of 0.1 kg. The accuracy (bias) is the ability of the instrument to measure the accurate value. In other words, it is the closeness of the measured value to a standard or true value. It is often related to calibration problems.
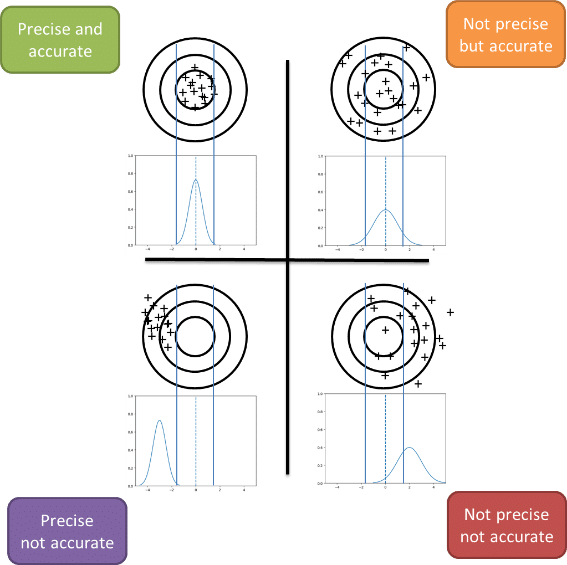
Ok, take a deep breath, because now we go for the statistical error. As said before, the statistical error is related to the fact that the quantity you are trying to measure is not constant in the time interval you are measuring it. Taking the same example of the scale weight, you could repeat your weight measurement is different time of the year, or in different years with the same scale weight tool. The results would very likely be different (in particular after Christmas holidays). So, you should say “my weight is (72 ± some_systematic_error ± some_statistical_error) kg”, where some_statistical_error is evaluated looking at the repeated measurements (for example, you can take the variance of your measurement) and some_systematic_error is the error described before. We define “precision” as a synonym of statistical error. SO, you can have different situations: precise but not accurate, precise and accurate and so on (as shown in fig).
The standard method to combine statistical and systematic error is to combine them using the square sum.

Real world example
Let’s take a satellite-based analysis as a real-world example. As let’s as take World View 3, following the musical assonance. WorldView-3 (see fig) is one of the latest satellites of DigitalGlobe’s constellation of very high-resolution satellites. WorldView-3 was launched in August 2014 and collects images from an altitude of 617 km with a global capacity of 680,000 km2 per day. Ground resolution (ground sampling distance, GSD) is around 0.31 m for panchromatic images at nadir (0.34 m at 20° Off-Nadir), 1.24 m for multispectral images at nadir (1.38 m at 20° Off-Nadir), and 3.7 m for SWIR images at nadir (4.10 m at 20° Off-Nadir). The GSD is the distance between the centres of two neighbouring pixel in the image on the ground. This is our spatial resolution (x-y plane) [5].
The raw bias (accuracy) can be evaluated comparing ground truth objects position with the position indicated by the satellite imagery. For WorldView-3, it is typically of the order of 3.5 m, evaluated using a circular error 90 at 90th percentile (CE90). This means that a minimum of 90 percent of the object points has a horizontal error less than the provided CE90 value.

Figure 1: Image Credit: DigitalGlobe
Comparing 3.5 m (raw bias) with a resolution of about 0.3 m, you would want to reduce the first error. Thus, post-processing techniques such as bias-compensating camera models are applied, taking as reference a set of ground control points (GCPs) measured by GPS and correct the raw satellite images.
For instance, different postprocessing techniques applied to WorldView-3 can reduce the bias up to about 0.7m x 0.7 m in the xy space.
That’s it for the systematic error. And we are even done, because in this case the object to be measured, that is for example the position of a tree near a power line, is not changing in the human time-scale. Thus, even if you get another picture from the satellite, the tree position should not be changed.
Your take-home message
Do not be scared of the nomenclature. Even if nobody can honestly say that he/she really masters Statistics, you still can have the right approach: try to understand the main source of uncertainty, and how it impacts on your initial goal.
Notes
[1] JCGM is an organization in Sèvres that prepared the “Guide to the expression of uncertainty in measurement” (GUM) and the “International vocabulary of metrology – basic and general concepts and associated terms” (VIM). The JCGM assumed responsibility for these two documents from the ISO Technical Advisory Group 4 (TAG4). For further information on the activity of the JCGM, see www.bipm.org.
[2] Namely:
- International Bureau of Weights and Measures (BIPM)
- International Electrotechnical Commission (IEC)
- International Federation of Clinical Chemistry and Laboratory Medicine (IFCC)
- International Organization for Standardization (ISO)
- International Union of Pure and Applied Chemistry (IUPAC)
- International Union of Pure and Applied Physics (IUPAP)
- International Organization of Legal Metrology (OIML)
- International Laboratory Accreditation Cooperation (ILAC)
[3] In the general sense of “doubt”.
[4] In the general sense of “doubt”.
[5] Take in mind: this intrinsic resolution can often be degraded by other factors which introduce blurring of the image, such as improper focusing, atmospheric scattering and target motion. The pixel size is determined by the sampling distance.
For the curious costumer
At i-EM S.r.l. we have what you need (we hope!)… Try us!
For the keen reader
Some further readings and references:
- Joint Committee for Guides in Metrology. “Evaluation of measurement data – Guide to the expression of uncertainty in measurement”. Technical report JGCM 100:2008, 2008.
- https://www.nde-ed.org/GeneralResources/ErrorAnalysis/UncertaintyTerms.htm
- https://www.bellevuecollege.edu/physics/resources/measure-sigfigsintro/b-acc-prec-unc/
- http://www.physics.utah.edu/~sid/physics2010/Uncertainty.pdf
- Barazzetti, Luigi & Roncoroni, F. & Brumana, R. & Previtali, M. (2016). GEOREFERENCING ACCURACY ANALYSIS OF A SINGLE WORLDVIEW-3 IMAGE COLLECTED OVER MILAN. ISPRS – International Archives of the Photogrammetry, Remote Sensing and Spatial Information Sciences. XLI-B1. 429-434. 10.5194/isprsarchives-XLI-B1-429-2016.
- F. Hu et al. “DEM EXTRACTION FROM WORLDVIEW-3 STEREO-IMAGES AND ACCURACY EVALUATION”, The International Archives of the Photogrammetry, Remote Sensing and Spatial Information Sciences, Volume XLI-B1, 2016 XXIII ISPRS Congress, 12–19 July 2016, Prague, Czech Repu
Author
Fabrizio Ruffini, PhD
Senior Data Scientist at i-EM


