

Data analysis in the renewable energy sector
Aka we want accurate info!
In our solar reports and online platforms, we have (potential) access to a lot of KPI: we have Performance Ratio, availability, inverter efficiency, capacity factor, performance index and many others. Sometimes, all KPIs are in agreement between each other, but often they are not, and we just keep looking at the ones we are more accustomed to, or the ones that we are more confident about the reliability.
Of course, sweeping dust under the rug can avoid headaches, but can also mean not taking actions where it is truly necessary and useful. Also, we paid something for this performance metrics, so it makes sense to make the best use of them.
Thus, we need to look at this KPI-dust. As usually happens, the devil is in the details; in this case, the details are the input data quality and the methods used for the KPI calculation. Let’s see some example on the PR calculation, to better visualize the problem.
As usually happens, the devil is in the details; in this case, the details are the input data quality and the methods used for the KPI calculation
Suppose we have a solar sensor installed in the plant, and a data acquisition system for that solar data. Independently, we also have a data acquisition system for the power produced. Combining them with the well-known PR-calculation function will give us the PR value.
Problem is: is it calculated in a good way?
In the first example, we see how the data from the solar sensor are not of high quality: they are significantly lower than expected, possibly due to data acquisition system problem. Thus, even if the production data are of good quality, we still end up with an unreliable PR value, maybe over 100% (you’d really like that, we know that ?, but the laws of physics are not so flexible…).
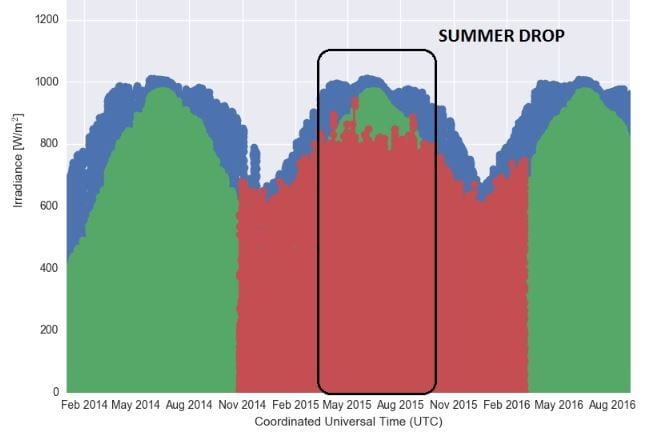
Figure 1: example of sensor data issues. Irradiance sensor data (in red) are compared with satellite global tilted irradiance data (blue) and with satellite-bases global horizontal data (green).
Another example could be a set of frozen power data related to some maintenance actions in some period. The resulting KPI would be very low, but it would not be a problem of performance (that is, actually, the “performance ratio” specific-goal), and the information on the performance will be lost somewhere in the space.
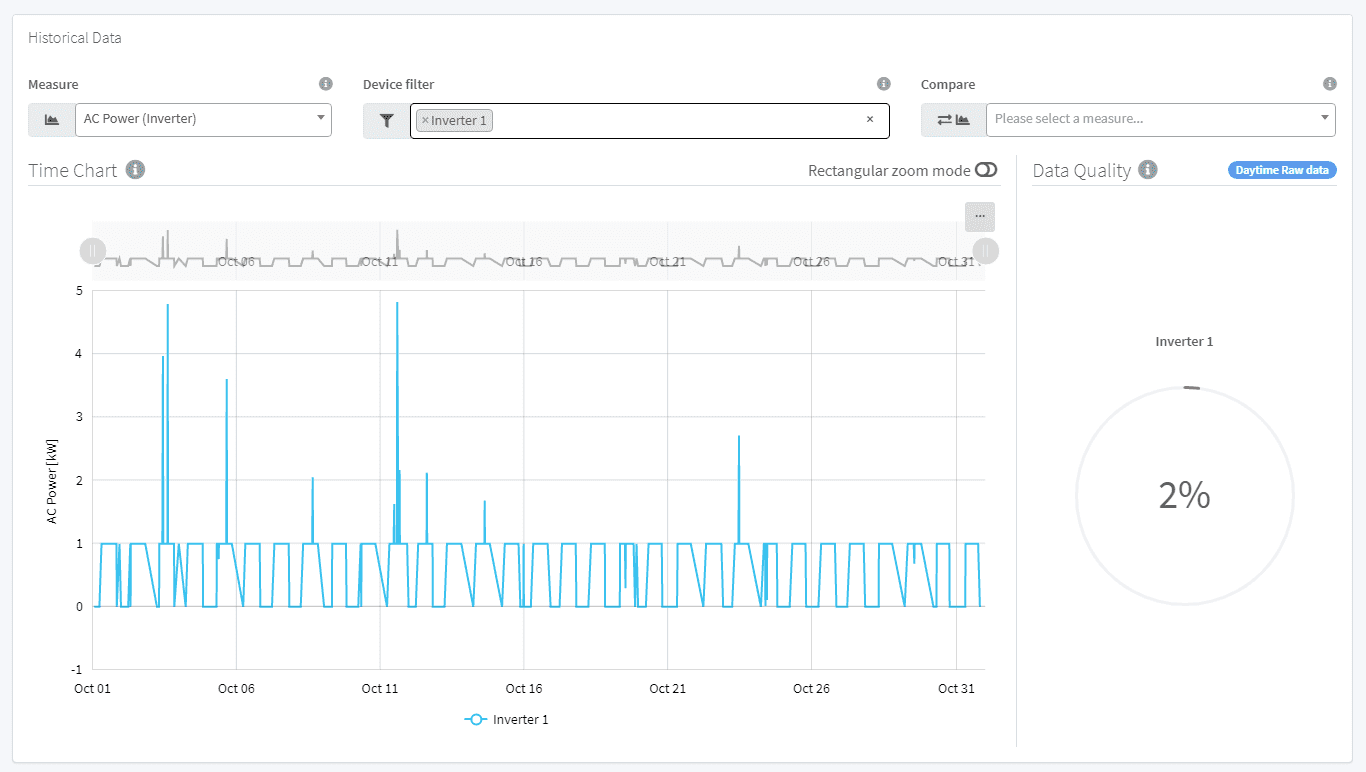
Figure 2: example of power data issues, with many frozen data (that is, data stuck to the same value for a not-reasonable time interval).
So, we need to take care of how we manage our input data: if they are not of high-quality, we need to process them to ensure that the final KPI convene the correct insight.
Fortunately for you, at i-EM we do that and we also provide a statistical evaluation of the data quality.
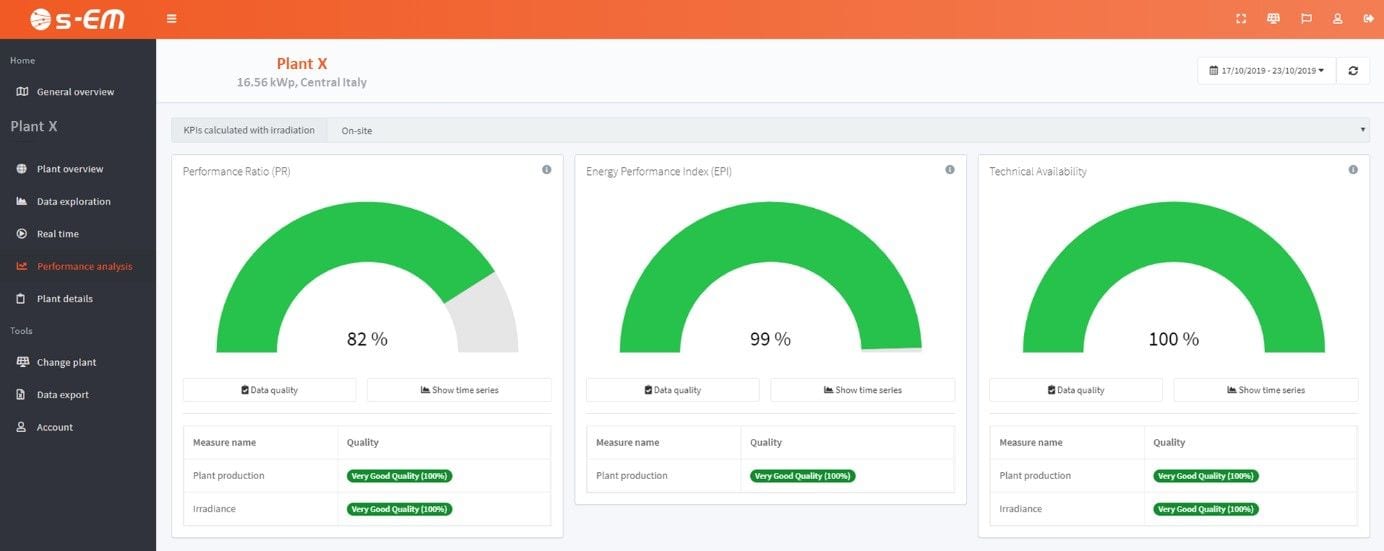
Figure 3: performance analysis section of the i-EM service.
We’ll talk about the data analysis steps in another post. At i-EM, we trust our KPIs, because we calculate them paying attention to details. Do you trust yours?
Author

Fabrizio Ruffini, PhD
Senior Data Scientist at i-EM

Antonio Piazzi, PhD
Senior Electrical Engineer at i-EM