Detect hot spots with infrared imagery
Intro
Considering 2008 as the “birthyear” of solar assets, we are in their “middle age” (where lifetime benchmark is usually set to 20 years, and replacement of main components is usually planned after 10 years). In particular, Europe has the oldest PV plant fleet.
A question for you: How is going your maintenance activities? Will you arrive at the end of the year and say: “Oh, our performance was very bad… maybe we should have done something.”? Good news is, you can do it, short-term! (You know it’s a good idea ?!).
In order to keep low O&M costs, traditionally a device is attached to every module to measure directly the electrical output and monitor the status.
However, such manual techniques are expensive, time-consuming and are not feasible for large PV plants.
Today, we will talk about Infrared monitoring (IR) activities, allowing a not-invasive screening of your solar plant status. This kind of activities are able to detect thermal abnormalities (“hot-spots” are the most famous ones) in the panels: basically, defects are at a higher temperature than functional cells since solar irradiance is not converted to current anymore and they get hot (you remember the Joule effect?); thus, they can be seen by IR cameras.
IR imaging measurements of the thermal behaviour of cells in a module allows a number of defects to be easily and quickly identified. The main thermal abnormalities in PV power plants are:
- Hot cells formally named as hot spots by
- Breakage of front glazing
- External shading (trees, buildings, dirt, bird dropping…)
- Internal cell problems (short circuits in solar cells, shunts, inactive cell parts, PID…)
- Heated bypass diodes inside the PV module junction box
- Heated string fuses in combiner box
- Heated DC and AC cables and connections points.
Also, hot spots that arise from poor electrical connections or severe mismatch within a module are another important type of failure that is usually easily detectable using IR.
In addition, images in the visible spectrum can be used, from human inspection (small plants), with drones or from satellite-based high-resolution imagery.

Figure 1: PV Module shows overheated cells due to shading by metal rod [2].

Figure 2: IR Thermography image of a PID affected system under sunlight conditions. The modules in the foreground show PID patterns with warmer cells close to the bottom frame [2].
Does it matter to you?
Hot spots with strong local heat gradients can affect the performance of the PV modules significantly and even, in extreme cases, lead to smoldering fires [2].
Thus, depends on your attitude: do you want to have your plant to be at the best or its current performance is enough for you? If you are not satisfied, you should think at this kind of service:
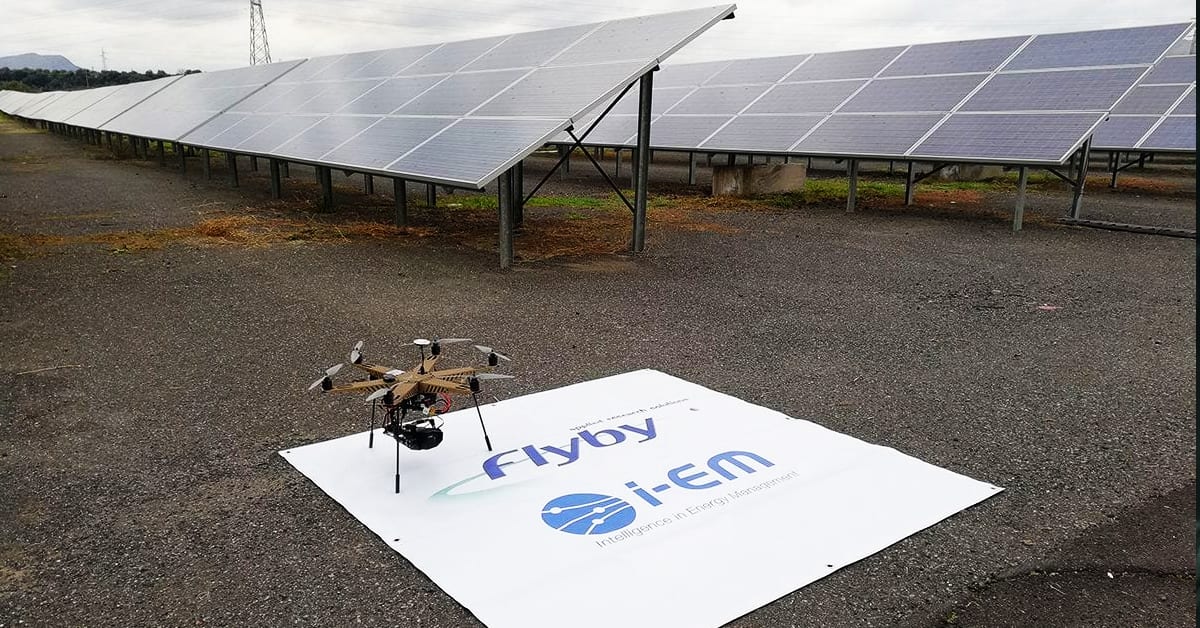
A drone equipped with a thermo-camera and a VIS camera is used for the screening, and an automatic artificial-based algorithm is used to detect and identify hotspot related issues.
For instance, a PV plant of 4 MWp could require approximately 5 to 15 hours of inspection [1]. It would be about a half the time of the same inspection using a hand-held IR camera.
How much would it cost?
The real question is how much it costs in relation with how much you gain. Of course, this strongly depends on the size, the old and the typical maintenance status of your plant.
Real world example
Let’s speak some numbers. Consider a 10 MWp plant in Italy; if due to the issues discussed above you are losing 10%, considering 1100 specific yield (numbers hold for in Italy, but are similar in Europe-area), that means you are losing 1100 MWh in a year. How much is it? Considering a feed-in-tariff of about 300 €/MWh, you do the math, and you get results: in one year, you could lose 330 keuro.
By contrast, an inspection (for instance, at i-EM) would have cost between 5-10 keuro/MW. How does it sound?
Case Study: plant near Napoli (Italy)
Recently, i-EM, in collaboration with his sister company FlySight, performed an aerial inspection of 25 MW rooftop Photovoltaic plant in the South of Italy.
During two weeks of hard work, more than 10.000 high-resolution VIS, low-resolution VIS and IR images have been collected. After post-processing activities and automatic anomalies detection applications to these images, the O&M team got an easy and efficient access to a user-friendly interactive report. The s-EM web GIS user interface provides information on each anomaly, in addition to details about the temperature. The latter, as you know, are very useful for hot spot detection!


Figure 3: Detail of a hot spot detected on the polycrystalline module reported by the s-EM web GIS user interface on ground-mounted Photovoltaic plant in Sicily. Hotspot temperature is automatically detected and shown on the UI.
Besides, not only hot spots were identified, as the combination of IR and VIS images allowed also to automatically detect soiling, raised panel, and other typical anomalies of rooftop installations.
Thanks to the platform, the O&M team rapidly scheduled its intervention strategy. Of course after some economic analysis!

Example of oxidized cells:

Example of hotspot due to bird droppings:

Example of multiple module detection due to dirt accumulation:


Example of raised panels:

In this case study, at i-EM we performed an inspection in a plant in Southern Italy, and we were able to identify thermic-related problems thanks to a combination of satellite VIS images and drone IR inspections. According to the issues identified, the customer could avoid up to 500 keuro per year of energy losses due to 5557 anomalies.
Final words
As a rule of thumbs, you should start worrying when the thermal anomalies are 15-20 degrees higher than the default panels (pointwise spots), or when a pattern is easily recognizable. Truth be told, contactless IR imaging acquired by drone mounted IR-cameras cannot detect very small defects, such as microcracks, due to low resolution. For this kind of problem, you should look for different techniques, such as Electroluminescence Imaging (EL) or other approaches.
Notes
[1] Taking into consideration that all the other factors that might influence the inspection are ideal. (See reference)
[2] https://iea-pvps.org/wp-content/uploads/2020/01/Review_on_IR_and_EL_Imaging_for_PV_Field_Applications_by_Task_13.pdf. (See reference)
For the curious costumer
Just by chance, at i-EM S.r.l. we have a solution for your hot spot problems using drones or satellite data… Try us!
For the keen reader
- In IEA-PVPS survey, less than half of the contracts included advanced inspection techniques such as infrared imaging (IR) inspection for the modules, electrical cabinets or junction boxes. The frequency of inspection was either annual or biannual. Take a look at the report: Report IEA-PVPS T13-08:2017]
Author

Fabrizio Ruffini, PhD
Senior Data Scientist at i-EM

Lorenzo Gigoni
Technical Sale Engineer at i-EM

Giacomo Fontanelli
Application Specialist at FlySight