
Goal
The g-EM smart grid area-solution is developed to tackle many challenges related to the smart grid context, such as the necessity to ensure a stable, reliable and efficient electricity system, or to monitor and optimize the smart grid behaviour in presence of new complex elements related to renewable technologies and business opportunities.
More precisely, this solution contains two services:
- the g-EM Smart Grid Management service (g-EM.SGM), which is a smart grid management tool;
- the g-EM.e-Mobility service, which focuses on the optimization of a smart grid functioning by exploiting the e-mobility element via smart charging and V2G technologies.
Background
The expansion of smart grids offers the opportunity for the diffusion of new market services introducing intelligence and new technologies to improve smart grids autonomy and resiliency. Control and monitoring of the energy flows in the smart grid allow new and dynamic business models, which enable for instance efficient demand management in order to stabilize the grid by adapting the end clients’ energy consumption.
This means that commercial and industrial customers can respond to market signals, increasing or reducing consumption in response to peaks in energy supply and demand. Finally, new elements like the electric-mobility (e-Mobility) will play an important role in the smart grid context and represent a precious resource to be exploited to efficiently manage a smart grid.
In this context, the g-EM smart grid solution is proposed to face some challenges of the short/medium-term, related to the increasing complexity of the electrical grid ecosystem described above:
- Face grid quality-related issues: frequency and load issues;
- Monitor and optimize smart grid behaviour in presence of several new complex elements;
- Manage new business opportunities taking advantage of Industry 4.0 features (cybersecurity, resilience, flexibility, Big Data).
How
The two g-EM services – SGM and e-Mobilty – utilize Space Assets and Big Data Analytics tools, constituting an added value to mitigate and also to overcome the key obstacles and challenges of managing a smart grid. The two services are strictly linked and for this reason they can be seen as two parts of a unique service for power flows balancing monitoring and management. g-EM.SGM and g-EM.e-Mobility are divided into two main components, one focused on the monitoring and managing, and one focus on the ticketing.
Smart grid monitoring and managing
The service answers the system operators need of monitoring the smart grid behaviour, as described above, using Big Data Analytics in combination with Space Assets. The several elements of the smart grid will be monitored, and a decision support system will face the power quality and continuity needs, suggesting how to best operate the grid. The decision support system will also take into account short term weather forecasting (nowcast) information to avoid balancing related problems; for medium and long term planning, the system will be able to use independent sources of data to predict possible abrupt changes in the supply/demand balance, such as the synchronous switching on/off of domestic power supplies or the simultaneous plug-in of e-vehicles during on/off-work-times. The goal is to provide a service that is able to fully support operators in addressing the issues related to a multi-level smart grid structure.
Smart grid ticketing
Once anomalies or decisions have been made evident by the previous system, the ticketing service will answer the system operators need of scheduling appropriate inspections or external actions (e.g., requests to manufacturers). The system will be able to plan the operations, provide guidance suggesting recommended actions based on domain expertise and archive logbooks, and finally save and store the lesson learned.
The output
The SGM service is designed to monitor and manage power flows in a smart grid. More precisely, it provides predictions of generation/consumption balancing, both for long-term activities (for example, using weekly/workdays/monthly archive data for the profiling) or for short-term activities (anomaly detection and weather nowcast-related info).
The g-EM.e-Mobility service exploits the e-Mobility elements (e-Vehicles and charging stations) and grid-metering elements to support the grid in the power flows management by means of smart charging and V2G technologies.
The g-EM.e-Mobility service can be added to the g-EM energy management system to be capable of modeling all of the most relevant features of the smart grid, thus monitoring and optimizing the global behaviour.
Let’s have a look!
g-EM.e-Mobility
The g-EM.e-Mobility service meets the need of monitoring and optimizing smart grid behaviour exploiting the e-mobility elements (i.e. e-vehicles and charging stations) to preserve the grid energy supply balancing in case of failures or imbalances of the other grid elements (fossil-fuel based elements, renewable energy power plants, etc…).
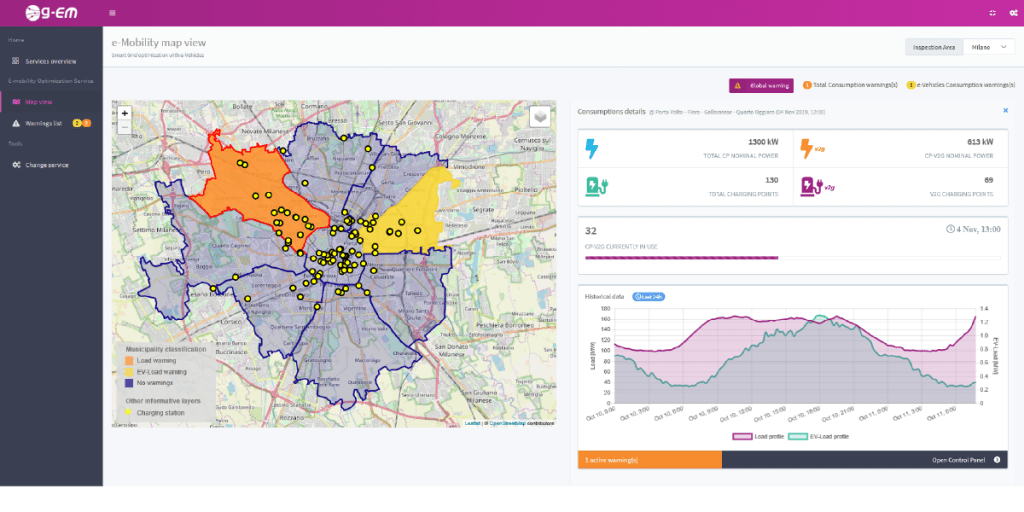
Figure 1: e-Mobility service map view.
The main page of the service mock-up shows the map of Milan, each charging station installed within the urban area is geolocated with a yellow circle marker.
By clicking on a municipality, a side panel appears showing general information about the district area in terms of:
- nominal power
- nominal power of V2G-enabled charging points
- charging points count
- V2G-enabled charging points count
- V2G-enabled charging points currently in use (real-time data)
The time chart shows the historical profile of total consumptions and of consumptions for e-elements over a period of 24 hours backwards, aggregated per district area. At the bottom of the panel a text field shows the active warnings affected the district area.
By clicking on the “Open Control Panel” link, the operator can inspect the forecast profile of the expected total consumptions and of the expected e-elements consumptions up to 2 hours ahead.
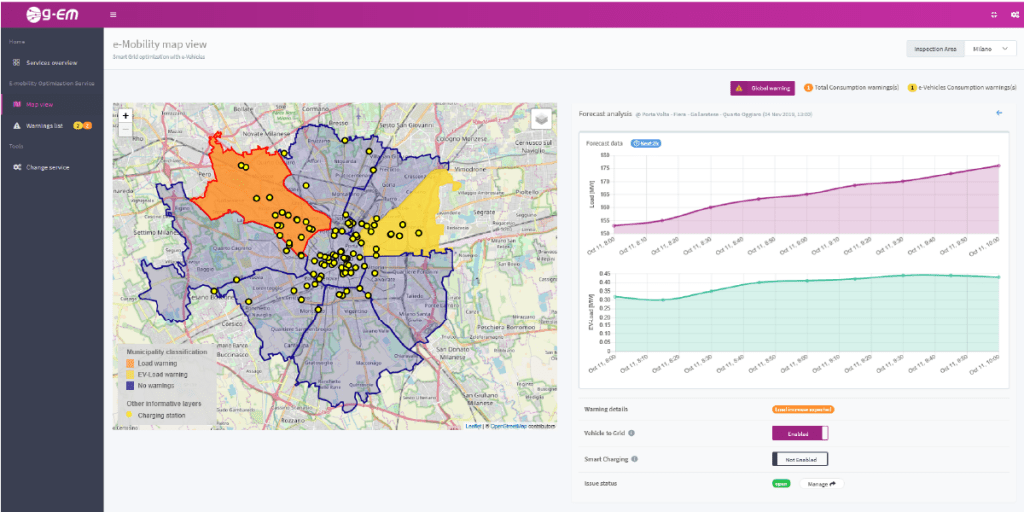
Figure 2: Control panel.
In the lower section of the panel, more detailed information about the active warnings (if any) are displayed.
The operator can trigger the activation of Vehicle-to-Grid and Smart-Charging technologies on all the enabled charging points populated the affected district area, in order to prevent the expected unbalance behaviour of the grid.
The output of this service is smart grid behaviour monitoring and forecasting.
By clicking the “Warning list” menu item on the navigation panel on the left side, the list of all expected consumption anomaly issues is shown. Every issue is described by info about the current operative status (e.g. Open, Pending, Closed, Unassigned), the priority, the issue assignee, the description, the issue creation date and the classification of the expected anomaly (e.g. total consumptions or e-elements consumptions). This is a preliminary version of the ticketing platform for the e-Mobility service.
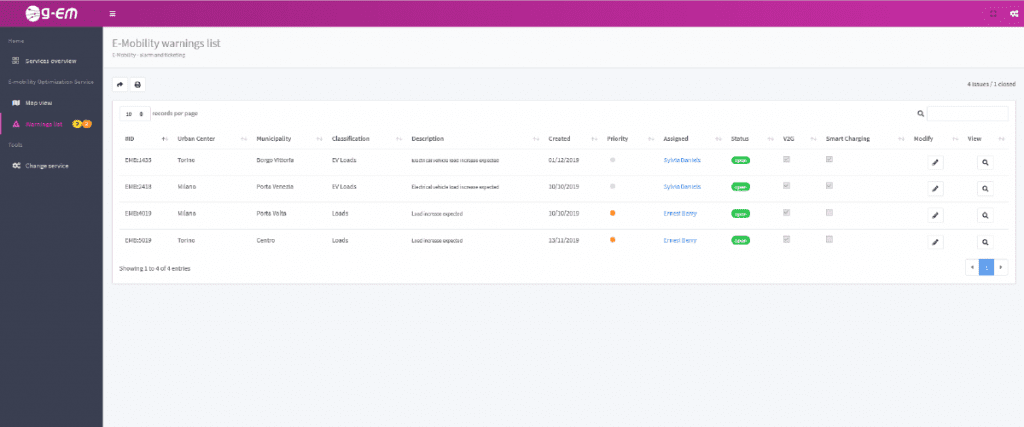
Figure 3: e-Mobility ticketing service.
g-EM.SGM
The g-EM Smart Grid Monitoring service answers the need of monitoring and optimizing smart grid behaviour in presence of several distributes and complex elements. Performing a simulation of a smart grid behaviour by modelling storage system, renewable energy power plants, load and fossil-fuel based elements it aims to predict possible failures on the grid and provide performance reports to the operator.
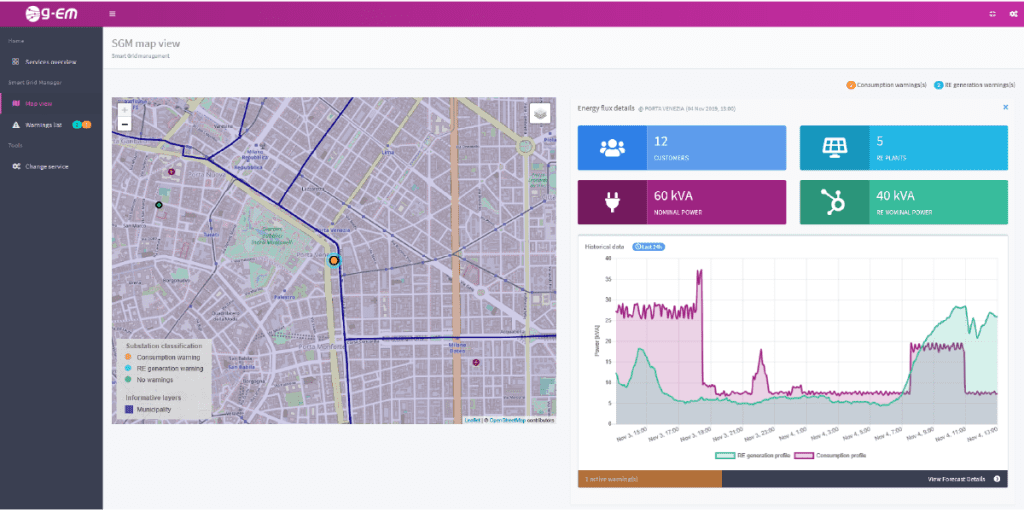
Figure 4: SGM service map view.
The main page of the service mock-up shows the map of Milan, populated with coloured markers in correspondence with each substation located in the urban area.
A warning concerning to a substation is notified if anomalous consumptions or energy supply from renewable sources is expected up to 2 hours ahead. This information is shown as colour on the related marker as follows:
- green: no active warnings
- yellow (blinking): warning due to expected consumption anomaly
- cyan (blinking): warning due to expected renewable energy supply anomaly
By clicking on a circle marker, the side panel appears showing general information about the substation:
- customers
- energy renewable plant count
- nominal power
- nominal power from renewable energy
The time chart shows the historical profile of consumptions and energy generation from renewable sources over a period of 24 hours backwards. At the bottom of the panel a green, yellow or cyan field shows the active warnings on the substation. The colour is the same used for the substation marker.
By clicking on the “View Forecast Details” link, the operator can inspect the forecast profile of the excepted consumptions on the substation and of the energy supply from renewable sources up to 2 hours ahead.
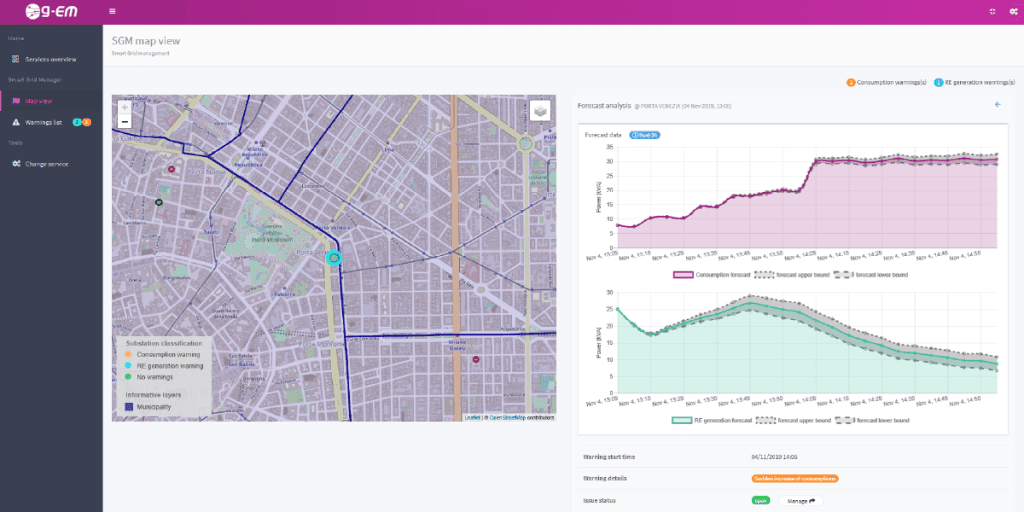
Figure 5: Forecast and warning details.
In the lower section of the panel, more detailed information about the active warnings (if any) are displayed. The output of this service is smart grid behaviour monitoring and forecasting.
By clicking the “Warning list” menu item on the navigation panel on the left side, the list of all expected consumption/energy supply anomaly issues is shown. Every issue is described by info about the current operative status (e.g. Open, Pending, Closed, Unassigned), the priority, the issue assignee, the description, the issue creation date and the classification of the expected anomaly (e.g. consumptions or Renewable Energy generation). This is a preliminary version of the ticketing platform for the Smart Grid Manager.
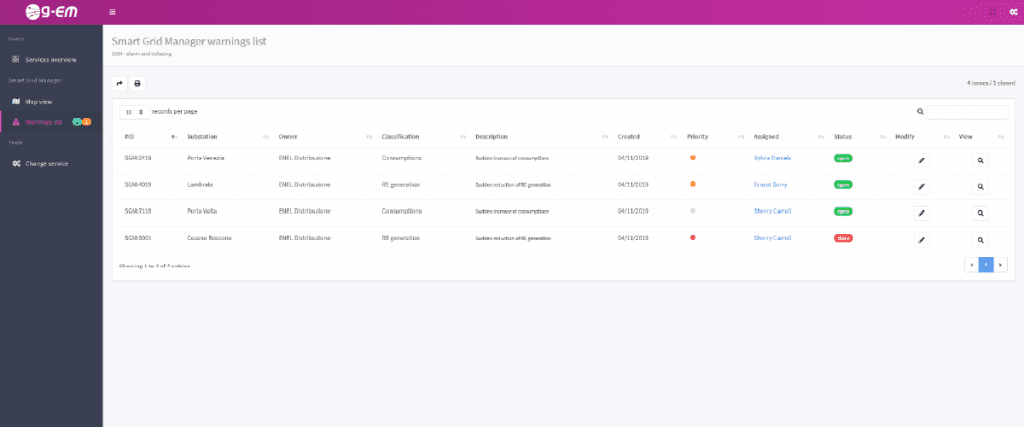
Figure 6: SGM ticketing system.
Involved technologies
Earth Observation, Satellite navigation, Big Data Analytics, Open Data, Artificial Intelligence.