
This service will provide a risk management tool to avoid incidents due to the vegetation close-by to the power lines and to prioritize maintenance initiatives in field. Trees, grass but also other obstacles (i.e. temporary infrastructure) in proximity of the conductors will be historically analyzed taking into account also other factors like ground characteristics and weather conditions.
Applying the critical area detection to cover large geographical areas, safe zones can be distinguished from the ones that need to be inspected more in details. Critical areas are then processed to evaluate the distance from conductors and identify the risk level of each line segments. The system can identify possible problems in the right of way, postprocessing 2D RPAS data with 3D techniques to estimate the distances between power lines and vegetation.
Finally, through a multispectral time-series analysis and applying newest deep machine learning tools specifically focused on image data analysis the prognosis of the vegetation growth speed can be extracted, allowing to assess “future” risks and forecasting when the alarm thresholds will be overwhelmed.
The output of this service will be a monitoring service, with ad hoc reporting capabilities. Reports will be additional inputs for the following ticketing service. An overall schema of the system is shown in next figure.
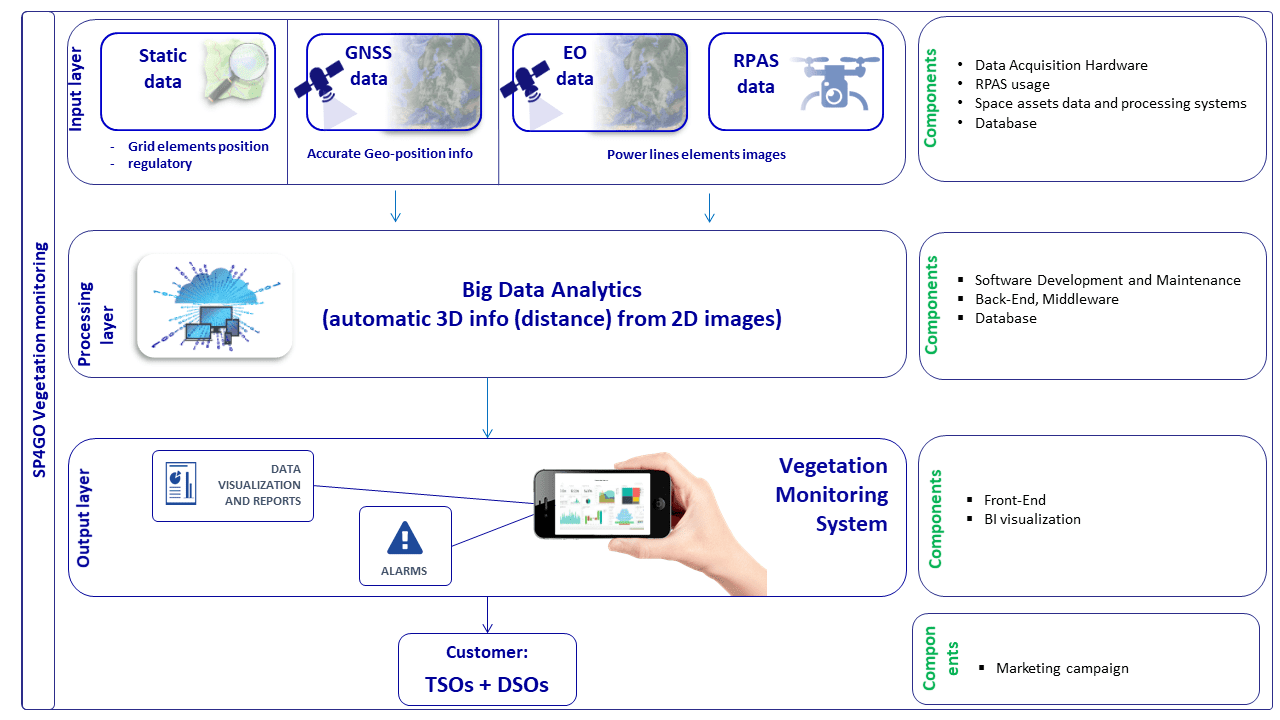
Figure 1: SP4GO vegetation monitoring system schema.
Two solutions are currently offered: VegeEO, a concrete solution to exploit multiple satellite datasets, and VegeDRONE, combining satellites with drones for best performance results.
A deeper look into the g-EM.Vegetation service
The following paragraph refers to the service demonstrator.
The user can easily access service information from the status overview page where pylons, lines and information about past, present and future O&M operations are represented. Here the overall situation can be monitored, showing a satellite map with classified conductor segments, allowing the user to focus on the ones that need attention according to their clearance risk evaluation.
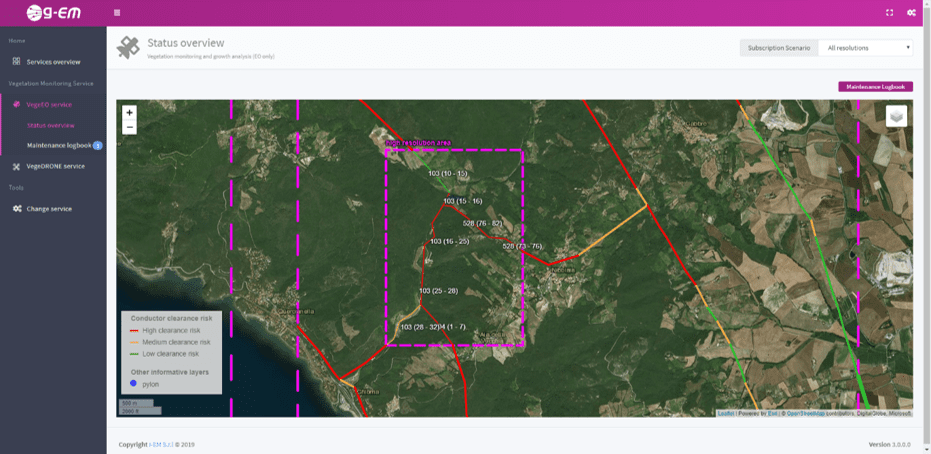
Figure 2: Vegetation monitoring status overview.
Each segment exposes its vegetation insight, providing a section with general information on the power line, a maintenance logbook where O&M activities are listed and a risk evaluation section where information about involved data assets and single risk key indicators are shown.
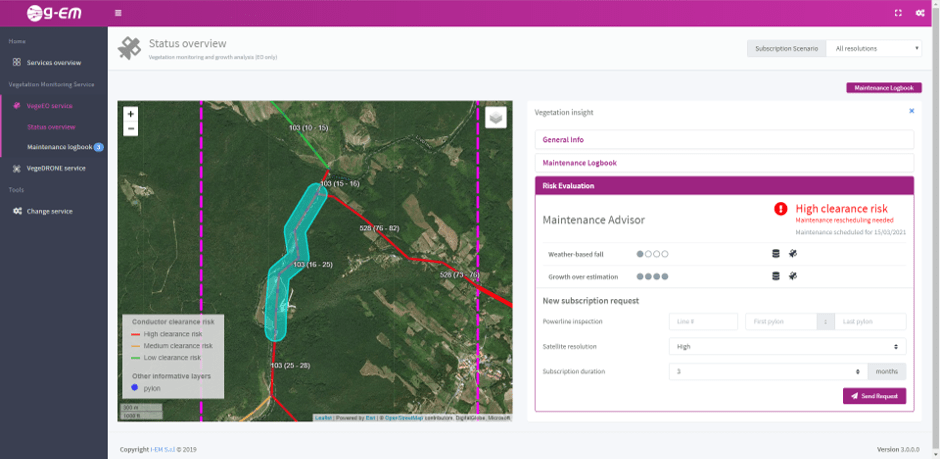
Figure 3: Vegetation insight view.
When an alarm is detected, prompt alerts and suggestion about O&M activities rescheduling are described here. The same tool allows to easily manage new area subscriptions, to analyze uncovered zones or request for deeper analysis.
In the VegeDRONE solution, an RPAS inspection view will also be accessible. Its aim is to provide useful information about the inspection status (i.e. if a new one has been scheduled) and to show detected warnings underneath the segment. The video processing results can be examined to identify details about the issue and plan O&M activities accordingly.
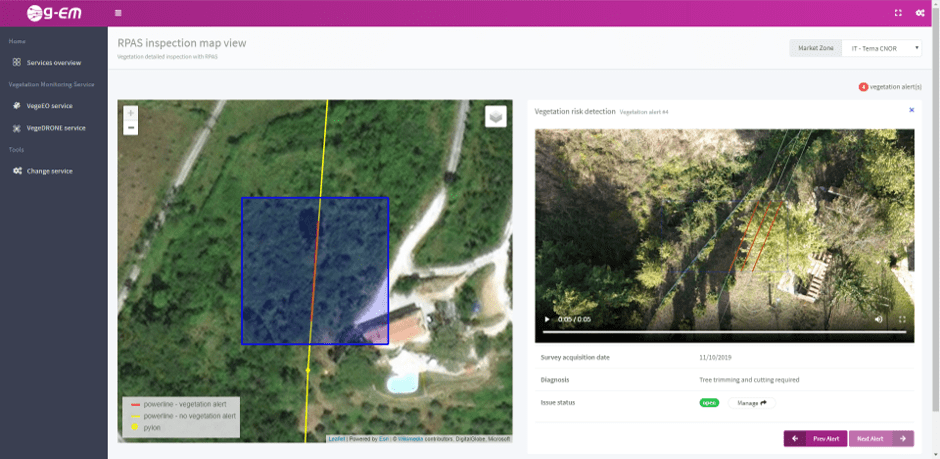
Figure 4: RPAS inspection view.
Involved technologies
Earth Observation, Satellite navigation, RPAS, Data Analytics, Big Data, Open Data, Artificial Intelligence.
Service capabilites
Obtain imagery data from EO and RPAS platforms, and multispectral and multitemporal image processing analysis, obtain and process weather data, big data analytics, autonomous RPAS missions management, RPAS flight plan optimization, modelling vegetation growth in function of soil, canopy, O&M operations, weather and area specificities. Plan and reschedule O&M maintenance events.